Download
1 / 1
10 likes | 150 Vues
A Summary of HF RADAR Current Data Comparisons & Ongoing Projects Within the Chesapeake Bay Region. Local Projects & Applications. Data Comparisons. Comparisons with NOAA ADCP Data. Local Search & Rescue.

E N D
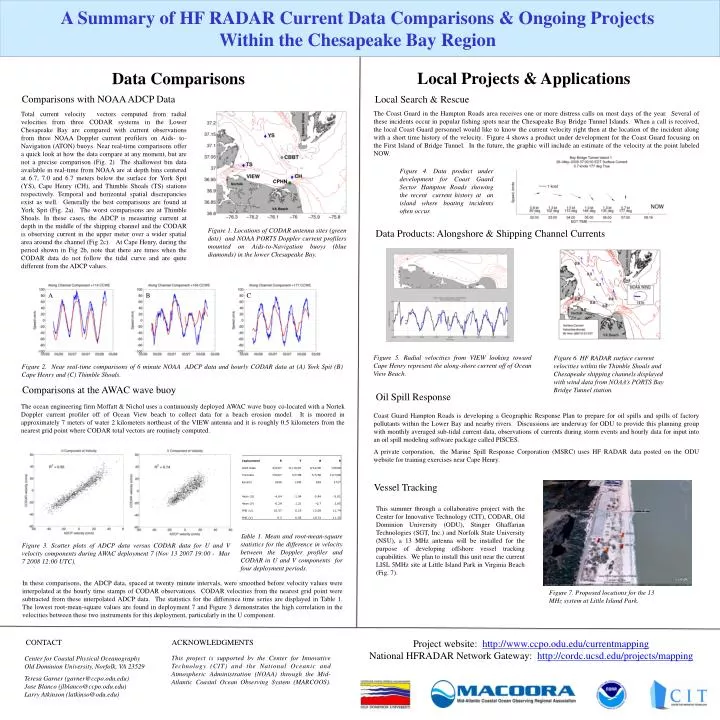
A Summary of HF RADAR Current Data Comparisons & Ongoing Projects Within the Chesapeake Bay Region Local Projects & Applications Data Comparisons Comparisons with NOAA ADCP Data Local Search & Rescue The Coast Guard in the Hampton Roads area receives one or more distress calls on most days of the year. Several of these incidents occur in popular fishing spots near the Chesapeake Bay Bridge Tunnel Islands. When a call is received, the local Coast Guard personnel would like to know the current velocity right then at the location of the incident along with a short time history of the velocity. Figure 4 shows a product under development for the Coast Guard focusing on the First Island of Bridge Tunnel. In the future, the graphic will include an estimate of the velocity at the point labeled NOW. Total current velocity vectors computed from radial velocities from three CODAR systems in the Lower Chesapeake Bay are compared with current observations from three NOAA Doppler current profilers on Aids- to-Navigation (ATON) buoys. Near real-time comparisons offer a quick look at how the data compare at any moment, but are not a precise comparison (Fig. 2) The shallowest bin data available in real-time from NOAA are at depth bins centered at 6.7, 7.0 and 6.7 meters below the surface for York Spit (YS), Cape Henry (CH), and Thimble Shoals (TS) stations respectively.Temporal and horizontal spatial discrepancies exist as well. Generally the best comparisons are found at York Spit (Fig. 2a). The worst comparisons are at Thimble Shoals. In these cases, the ADCP is measuring current at depth in the middle of the shipping channel and the CODAR is observing current in the upper meter over a wider spatial area around the channel (Fig 2c). At Cape Henry, during the period shown in Fig 2b, note that there are times when the CODAR data do not follow the tidal curve and are quite different from the ADCP values. Figure 4. Data product under development for Coast Guard Sector Hampton Roads showing the recent current history at an island where boating incidents often occur. CPHN Figure 1. Locations of CODAR antenna sites (green dots) and NOAA PORTS Doppler current profilers mounted on Aids-to-Navigation buoys (blue diamonds) in the lower Chesapeake Bay. Data Products: Alongshore & Shipping Channel Currents A B C Figure 5. Radial velocities from VIEW looking toward Cape Henry represent the along-shore current off of Ocean View Beach. Figure 6. HF RADAR surface current velocities within the Thimble Shoals and Chesapeake shipping channels displayed with wind data from NOAA’s PORTS Bay Bridge Tunnel station. Figure 2. Near real-time comparisons of 6 minute NOAA ADCP data and hourly CODAR data at (A) York Spit (B) Cape Henry and (C) Thimble Shoals. Comparisons at the AWAC wave buoy Oil Spill Response The ocean engineering firm Moffatt & Nichol uses a continuously deployed AWAC wave buoy co-located with a Nortek Doppler current profiler off of Ocean View beach to collect data for a beach erosion model. It is moored in approximately 7 meters of water 2 kilometers northeast of the VIEW antenna and it is roughly 0.5 kilometers from the nearest grid point where CODAR total vectors are routinely computed. Coast Guard Hampton Roads is developing a Geographic Response Plan to prepare for oil spills and spills of factory pollutants within the Lower Bay and nearby rivers. Discussions are underway for ODU to provide this planning group with monthly averaged sub-tidal current data, observations of currents during storm events and hourly data for input into an oil spill modeling software package called PISCES. A private corporation, the Marine Spill Response Corporation (MSRC) uses HF RADAR data posted on the ODU website for training exercises near Cape Henry. (a) Vessel Tracking This summer through a collaborative project with the Center for Innovative Technology (CIT), CODAR, Old Dominion University (ODU), Stinger Ghaffarian Technologies (SGT, Inc.) and Norfolk State University (NSU), a 13 MHz antenna will be installed for the purpose of developing offshore vessel tracking capabilities. We plan to install this unit near the current LISL 5MHz site at Little Island Park in Virginia Beach (Fig. 7). Table 1. Mean and root-mean-square statistics for the difference in velocity between the Doppler profiler and CODAR in U and V components for four deployment periods. Figure 3. Scatter plots of ADCP data versus CODAR data for U and V velocity components during AWAC deployment 7 (Nov 13 2007 19:00 - Mar 7 2008 12:00 UTC). In these comparisons, the ADCP data, spaced at twenty minute intervals, were smoothed before velocity values were interpolated at the hourly time stamps of CODAR observations. CODAR velocities from the nearest grid point were subtracted from these interpolated ADCP data. The statistics for the difference time series are displayed in Table 1. The lowest root-mean-square values are found in deployment 7 and Figure 3 demonstrates the high correlation in the velocities between these two instruments for this deployment, particularly in the U component. Figure 7. Proposed locations for the 13 MHz system at Little Island Park. Project website: http://www.ccpo.odu.edu/currentmapping National HFRADAR Network Gateway: http://cordc.ucsd.edu/projects/mapping ACKNOWLEDGMENTS CONTACT Center for Coastal Physical Oceanography Old Dominion University, Norfolk, VA 23529 Teresa Garner (garner@ccpo.odu.edu) Jose Blanco (jlblanco@ccpo.odu.edu) Larry Atkinson (latkinso@odu.edu) This project is supported by the Center for Innovative Technology (CIT) and the National Oceanic and Atmospheric Administration (NOAA) through the Mid-Atlantic Coastal Ocean Observing System (MARCOOS).