Download
1 / 38
380 likes | 508 Vues
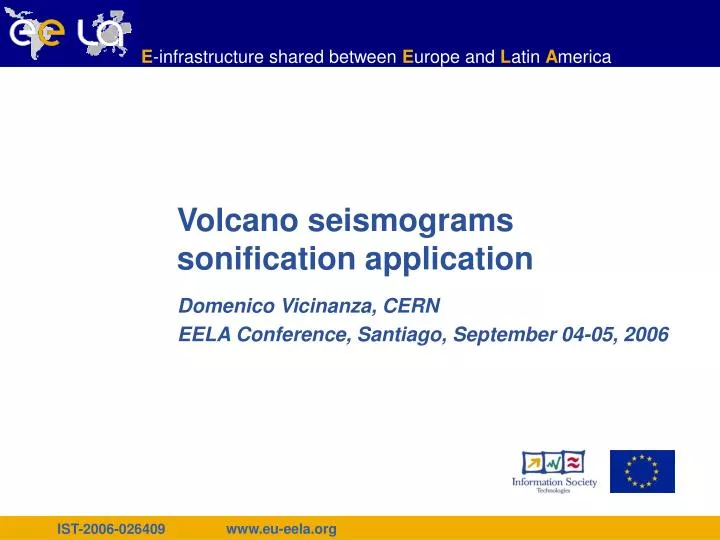
Volcano seismograms sonification application. Domenico Vicinanza, CERN EELA Conference, Santiago, September 04-05, 2006. Volcano eruption forecasting. Currently no definitive method to predict the eruption of a volcano has been discovered or implemented (yet). Scientists monitor

E N D
Volcano seismograms sonification application Domenico Vicinanza, CERN EELA Conference, Santiago, September 04-05, 2006
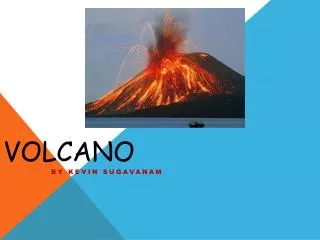
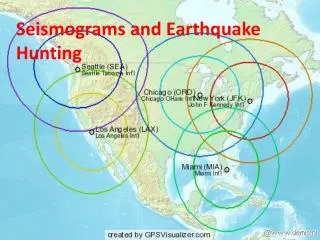
Volcano eruption forecasting • Currently no definitive method to predict the eruption of a volcano has been discovered or implemented (yet). • Scientists monitor • seismic waves • number of earthquakes and the intensity of a specific type of quake (harmonic tremors) in the run up to eruptions. • changes in the shape of the volcano or concentrations of gases emitted from the cone. Santiago, Chile, EELA Conference, 05.09.2006
The hope: music for forecasting • By correlating spectra and melodies with precise stages of volcanic activity we hope to discover a sort of “signature tune” of an imminent eruption or earthquake. • By identifying musical patterns that warn of an eruption it would be possible to implement civil protection measures, days or even hours before the event Santiago, Chile, EELA Conference, 05.09.2006
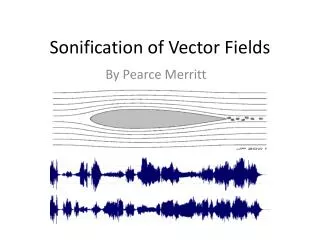
Data Audification • Data audification can be considered as the acoustic counterpart of data graphic visualization, a mathematical mapping of information from data sets to sounds. • Data audification is currently used in several fields, for different purposes: • science and engineering, • education and training, mainly as data analysis and interpretation tool. • Although most data analysis techniques are exclusively visual in nature, data presentation and exploration systems could benefit greatly from the addition of sonification capabilities.
Motivations • Sonic representations are particularly useful when dealing with complex, high-dimensional data, or in data monitoring tasks where it is practically impossible to use the visual inspection, or for pattern detection. • Research has shown that people are quite more confident in recognizing patterns audibly rather then visually • Music theorists and researchers have carried out in centuries of history lots of techniques and methods to detect, study and classify musical phrases • Main idea: Music as a language and music analysis as a tool to inspect scientific data
Sonification on the GRID network • First experiments involving sound production with INFN-GRID facilities started during the last months of 2003. • In September 2003, it was installed CSound, a free and cross-platform acoustic compiler, on a GRID test site, the Catania INFN-GRID computer farm • The compiler was tested within the new environment and since its beginning, the test phase produced interesting results: efficient use of the calculus resources, customizable quality of the audio files. Santiago, Chile, EELA Conference, 05.09.2006
Second Phase: Java • Second test phase: development of a sound production suite based on Java (equipped with the standard audio and math libraries), more flexible and easy to manage. • All the results presented in this website have been carried on using this last approach: sample computation, audio rendering, DFT computing were obtained with the Java sonification program on the GRID Executable = "/bin/sh"; StdOutput = "sonification.out"; StdError = "sonification.err"; InputSandbox = {"sonification.sh", "Sonification.java", "etna.dat"}; OutputSandbox = {"Sonification.aiff", "Sound.dat","Spectrum.dat", "sonification.out","sonification.err", "logfile"}; RetryCount = 7; Arguments = "sonification.sh";
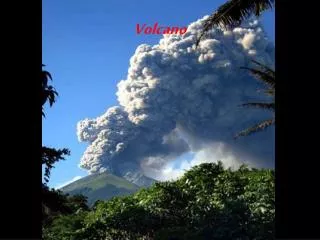
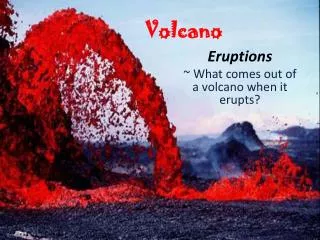
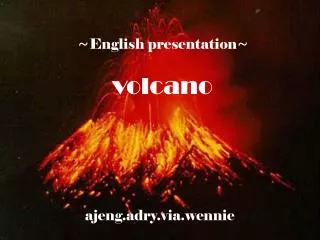
Sound form volcanoes • Sonified data were geophysical data collected by digital seismographs placed on the Etna volcano in Catania (Italy) and on Tungurahua volcano in Ecuador. • We carried out two sonifications: • seismogram straight sonification (tranformation into an audible waveform) • seismogram melodisation (tranformation into a melody) Etna Volcano Tungurahua (Picture: M. Monzier IRD/IG-EPN)
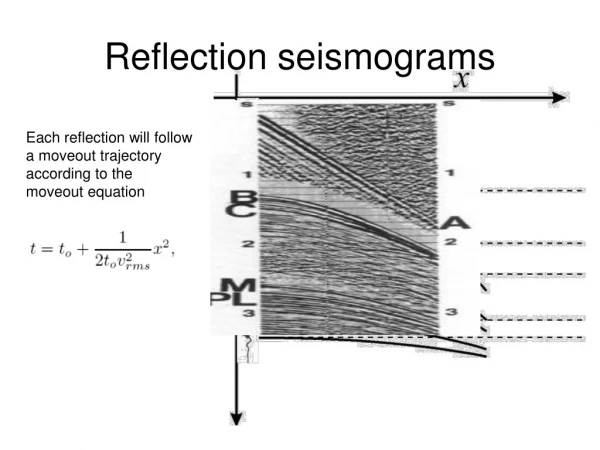
About seismograms audification • In both the cases, structural properties of the seismographic information would be straightly mapped into sound or melody properties • In the first case, regularities in the seismograms will be reflected by the existence of spectral lines in the sonified signal • In the second case, regularities in the seismograms will be transferred into regularities in the melody (such as a repeated set of data will become a repeated musical phrase) Santiago, Chile, EELA Conference, 05.09.2006
Original data • Example of ASCII files processed (sample from Etna data): Starting time: 15/06/2001 00:03:39.920 Frequency: 100.1603 Hz Samples: 168960 44 43 42 44 44 46 43 45
First Sonification:From data to waveform • Scaling procedure to properly arrange the samples in the [-1,1] interval, according to their sampling frequency. • Users can specify in the sonification program a certain resample frequency (pitch shift). • Setting resample factors in the Java code greater than 1 won't preserve the original pitch, allowing a frequency shift... • ....making audible regular phenomena happening at very low frequencies. • In this way it is possible to observe and study periodical patterns, regular behaviors, long-range correlations, which can happen at different time scales. Santiago, Chile, EELA Conference, 05.09.2006
Quasi-regular phenomena • The waveform coded in the audio file will have exactly the same regularities, also recognizable thanks to the presence of some higher lines in the spectrum. • The order of magnitude of the frequency of quasi-regular phenomena is in the range 0-50 Hz, with a spectral envelope centered around 25-30 Hz. 20x resampled Etna seismogram
Tungurahua Waveform Santiago, Chile, EELA Conference, 05.09.2006
Tungurahua Spectrum Spectral lines = Regular patterns Santiago, Chile, EELA Conference, 05.09.2006
Tungurahua Sonogram Time evolution of the spectrum. Each vertical slice is the spectrum at a certain time Oscillation pattern variations are clearly visible in the pattern Santiago, Chile, EELA Conference, 05.09.2006
Etna sonification within GILDA https://gilda.ct.infn.it/ https://glite-demo.ct.infn.it/
Listening to sonification.aiff file Etna sonogram
Data melodization • The whole data set interval is mapped on the (equally tempered) piano keyboard • The min value of the seismographic data will correspond to the lowest playable note on the piano keyboard • The max value to the highest playable note Santiago, Chile, EELA Conference, 05.09.2006
Main advantages • Already available tools to manage MIDI files and analyze them • Tracking the evolution of the musical intervals, the dynamics of their patterns, it is possible to detect, with an high level and in a customizable way, any kind of modifications in the shape of seismogram. Two example of MIDI analysis (free) software: • Rubato (www.rubato.org) • MIDI Toolbox (http://www.jyu.fi/musica/miditoolbox/) Santiago, Chile, EELA Conference, 05.09.2006
MIDI Toolbox Santiago, Chile, EELA Conference, 05.09.2006
Dynamic evolution of the tonalities (related to couples of adjacent values) Santiago, Chile, EELA Conference, 05.09.2006
Example: Sinusoidal behavior • 0.00.5877852522920.9510565162950.9510565162950.5877852522920.0-0.587785252292-0.951056516295-0.951056516295-0.5877852522920.00.5877852522920.9510565162950.9510565162950.5877852522920.0 Graphical representation Original data
Sinus melodization Data are periodic, so the melody is periodic, with the same period Music representation (of the same set of data)
Melodization: a pictorial view • Pictorially we can say that the melodization works by overlaying seismograms with music notes • To create the volcanic score, we take a seismogram and trace the shape on to blank music bars. • Then we overlay the contours with musical notes. Santiago, Chile, EELA Conference, 05.09.2006
Seismograms Melodisation … have you ever heard a volcano playing a piano ?
Melody follows the shape of the oscillation Santiago, Chile, EELA Conference, 05.09.2006
First Etna-Tungurahua duet Players: • Mt Etna: Piano • Mt Tungurahua: Guitar Santiago, Chile, EELA Conference, 05.09.2006
Reference sites: • Etna Sonification website: http://grid.ct.infn.it/etnasound • Tungurahua Sonification web repository: http://grid.ct.infn.it/tungurahuasound • MIDI Toolbox manual: http://www.jyu.fi/musica/miditoolbox/MIDI_Toolbox_Manual.pdf Santiago, Chile, EELA Conference, 05.09.2006
Thanks! …Questions Santiago, Chile, EELA Conference, 05.09.2006