Download

1 / 32
320 likes | 395 Vues
Substitution between Mass-Produced and High-End Beers . Daniel Toro-Gonzalez Ph.D. candidate , School of Economic Sciences (SES) Jill J. McCluskey Visiting Professor, Cornell University and Professor, SES, Washington State University and Ron C. Mittelhammer

E N D
Substitution between Mass-Produced and High-End Beers Daniel Toro-Gonzalez Ph.D. candidate, School of Economic Sciences (SES) Jill J. McCluskey Visiting Professor, Cornell University and Professor, SES, Washington State University and Ron C. Mittelhammer Regents Professor, SES & Dept. of Statistics Presented at Beeronomics Symposium UC Davis November 3, 2011
However, This is Changing • Mass producers’ market share still represents the vast majority of sales, but their sales are flat or declining. • Trend of consumers switching from mass to craft beers. • Consistent with general shift in food preferences: • Increasing desire for variety, taste, and local products.
We know that consumers shift from macro to craft brews. Does it go the other way? • “…consumers are very loyal to craft beers and not shifting to macro from craft. In economics terms the cross-price elasticity of craft and macro brews appears to be very inelastic, or that beer drinker do not think of macro lagers as a good substitute for micro brews.” - “Beeronomics: Is Craft Beer Recession Proof After All ?” , The Oregon Economics Blog, Thursday, May 7, 2009.
Project Objectives • Estimate demand for beer, which is a differentiated product. • Estimate the own-price, cross-price and income elasticities.
Data • Scanner data from 60 Dominick's supermarkets in Chicago. • Seven years of store-level weekly sales data (1991 to 1997) • 483UPCs for 343 brands. • Product info and store area sociodemographics
Market and Product Definition • Oligopolistic differentiated product market. • Each storeis treated as an independent market. • Each brand of beer is considered as a product.
Types of Beer • Mass produced beers are defined as those with similar characteristics of lightness, same fermentation method (bottom fermenting yeast) and the use of adjuncts such as corn or rice. • Import beers are those produced abroad. • The rest of the beers are called craft beers.
Number of Firms • Long term secular decline in traditional breweries • Rapid expansion in specialty breweries since 1980
Market Shares by Beer TypeSample Averages for Dominick Stores
Discrete Choice Model Issues • Model weekly aggregate sales at each store, by beer type • Address dimensionality problem (large number of underlying products) by projecting the products onto a characteristics space. • Market characterized by differentiated products. • Prices may be correlated with unobserved demand factors, causing endogeneity problem.
Discrete Choice Model • Utility of consumer i for product j depends on characteristics of both the product and the consumer: • Observed product characteristics, . • Unobserved product characteristics,. • Price,. • Consumer characteristics,. • Demand parameters,.
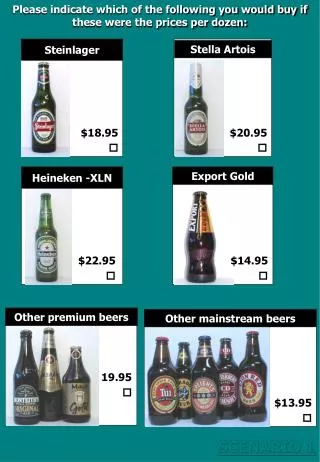
Observable Variables • Observed product characteristics: • Size of the bottle • Alcohol content • Type (Mass, Craft, Import) • Style (Ale, Fruit, Low Alcohol, Oktoberfest, Seasonal, Smoked, Steam, Stout, Wheat) • Price • Observed consumer characteristics: • Household income, home value, household size, education (% college graduates), ethnicity (% blacks+hispanics)
Discrete Choice Model • Linear specification of utility • where • xj is interpreted as the mean of consumers’ valuations of unobserved product characteristics (product quality). • Error term encompasses the distribution of consumer preferences around xj . • Errors are i.i.d. with “extreme value” distribution, resulting in a multinomial logit formulation.
Mean Utility Representation • Simply using dj to represent the mean utility for product j , which is defined as everything other than the error term:
Multinomial Logit • The market share of product j is then expressible in term of dj:
Multinomial Logit • Assuming the relationship between observed and predicted market shares is invertible, with the mean utility of the outside good (all other than beers) normalized to zero, • Prices and unobserved product attributes are correlated Endogeneity.
Instrument for Prices • Prices in other markets? (Hausman, 1996). • Prices of brand j in two markets will be correlated due to the common marginal cost. • But prices in other markets uncorrelated with the market-specific unobserved product characteristics.
MNL: Ignores endogeneity of prices. MNL-IV: Prices in other markets as IV for Price. Legend: * p<.1; ** p<.05; *** p<.01.
Problem with MNL • Independence of Irrelevant Alternatives (IIA). • Example, if a consumer wants to try a beer that is an American lager, he/she may consider alternatives like Coors light or Bud Light, but he will not consider any Stout type of beer.
Nested Logit Model • The NL preserves the assumption that consumer tastes are extreme value distributed. • Allows consumer tastes to be correlated across products. • More reasonable substitution patterns than in the previous model (a priori).
Nested Logit Model • We divide the products into g different exhaustive and mutually exclusive groups. • is common to all products in group g. • (1-σ) is the averagecorrelation in the random utility across products of the same group.
Nested Logit Model • Berry (1994) shows that if the errors are i.i.d. extreme value then: it is also distributed as a extreme value.
NestedLogit Model • We can represent the NL model as: where σ measures average similarity of products within each group of beer types. The new term is the log of the within group share.
PriceElasticities Source:Dominik’s dataset, calculations by the authors.
Compare with Other Findings Source: Table 2.2. Tremblay and Tremblay (2005).
Income Elasticities Source:Dominik’s dataset, calculations by the authors.
Price Elasticities: Other Findings Source: Table 2.2. Tremblay and Tremblay (2005).
Conclusions • Demand for beer is inelastic with respect to prices. • Cross-price elasticities are very close to zero. • Mass and craft beers are not close substitutes! • From the income elasticities, all of the types of beer (mass, craft, and import) are normal goods.
Next Steps • Estimate the model using a random coefficients specification for utility. • Allow for consumer heterogeneity. • Consumer characteristics can interact with product attributes. • Examine other formulations/instruments to tackle endogeneity between price and unobserved product characteristics.
Thank you and Cheers!Questions? (pictures from the Beeronomics Conference, Belgium May 2009)