Download
1 / 19
190 likes | 315 Vues
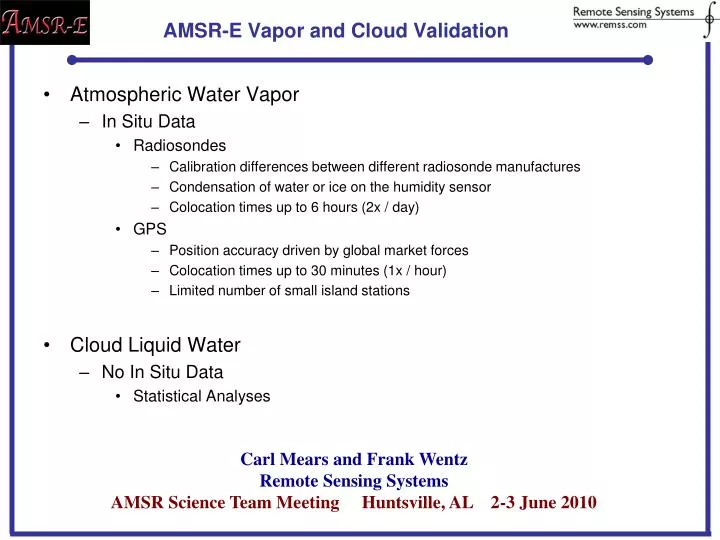
AMSR-E Vapor and Cloud Validation. Atmospheric Water Vapor In Situ Data Radiosondes Calibration differences between different radiosonde manufactures Condensation of water or ice on the humidity sensor Colocation times up to 6 hours (2x / day) GPS

E N D
AMSR-E Vapor and Cloud Validation • Atmospheric Water Vapor • In Situ Data • Radiosondes • Calibration differences between different radiosonde manufactures • Condensation of water or ice on the humidity sensor • Colocation times up to 6 hours (2x / day) • GPS • Position accuracy driven by global market forces • Colocation times up to 30 minutes (1x / hour) • Limited number of small island stations • Cloud Liquid Water • No In Situ Data • Statistical Analyses Carl Mears and Frank Wentz Remote Sensing Systems AMSR Science Team Meeting Huntsville, AL 2-3 June 2010
Ground-Based GPS Atmospheric Water Vapor Geologists have deployed a HUGE network of ground-based GPS stations to evaluate earth movements, etc. GPS measures the time needed for signals to go from GPS satellites to the ground. Time depends on distance and speed of light. Light slows according to amount of air and water vapor in the atmosphere above the station. Variable time delay is an error source for the geologists. It is a signal for meteorologists!
How does it work? By comparing the errors in derived location (typically 250 cm) from different zenith angles, deduce the zenith delay. Zenith Delay = Luckily, P/T = R*r, so the dry part of the integral is easy to do and only depends on the surface pressure Dry Delay Dry delay is typically 10-20 times wet delay, so we need accurate P Wet Delay = A climatological profile of T is used to perform the integral and obtain PW. Small print: I ignored ionopsheric delay – this is estimated and removed by using two different frequencies ….
GPS Station Selection • Out of thousands of stations, only 18: • Are located on small islands • Have over 1000 observations
Example Time Series • Many stations report hourly • Satellite colocation average: 15 minutes
Adjusting for Station Elevation • Elevations range from 8.46 m to 160 m. (577.46 m station excluded) • RSS (Mears) adjusts the reported PW to sea level using: • assumed RH (75%) and lapse rate (6.5K/km) • Reynolds SST for a surface temperature
Often, the data look quite good: Station MAC1, 54.5 S, 158 E, South of New Zealand Black = GPS Red = SSM/I Blue = SSM/I minus GPS
BUT, GPS is not infallible GOUG has a huge drift relative to all 3 satellites. (excluded from further analysis) Black = GPS Red = SSM/I Blue = SSM/I minus GPS
Sometimes, the problems are more subtle Drift relative to BRMU same in all 3 satellites Black = GPS Red = SSM/I Blue = SSM/I minus GPS
Instrumentation or methodology change? 603 shows a large jump relative to all satellites in early 2003. Black = GPS Red = SSM/I Blue = SSM/I minus GPS
Instrumentation or methodology change? Station 2003 shows a jump relative to all satellites in early 2001. Black = GPS Red = SSM/I Blue = SSM/I minus GPS
Overall statistics are very good Mean Mean Satellite SSM/I–GPS SSM/I-GPS Std. Dev. Total Number Name All Data GPS PW < 50 GPS PW < 50 Number GPS PW<50 ----------------------------------------------------------------------- f10 0.0798122 0.347921 1.87799 2073 1602 f11 -0.130406 0.101021 1.84340 8889 7166 f13 -0.121308 0.0690513 1.75293 29952 25170 f14 -0.110209 0.0652379 1.80464 28952 24136 f15 -0.186780 -0.0386894 1.80352 21812 18684 ----------------------------------------------------------------------- Total -0.129713 0.0504317 1.79396 91678 76758 ----------------------------------------------------------------------- AMSR-E -0.127 mm bias 16561 1.674 Std. Dev.
Cloud Liquid Water Validation • Lack of In Situ Data • Statistical Analysis • PDF • (probability distribution function) • Random Errors • Negative values • If true cloud water pdf has: • Peak at zero • Exponential decay • Then cloud water + noise -> • Half power point at zero
Cloud Liquid Water Validation • Clear Sky Bias (RSS CLW) • Clear sky scenes (other sensors) • Cloud average should be 0 • Finding: +.008 (RSS) - +.03 (others) • If true cloud water pdf has: • Spike at zero • Exponential decay • Then cloud water + noise -> • Values shift left
AMSR-E Vapor and Cloud Validation • Atmospheric Water Vapor – Carl Mears • In Situ Data • Radiosondes • Calibration differences between different radiosonde manufactures • Condensation of water or ice on the humidity sensor • Colocation times up to 6 hours (2x / day) • GPS • Position accuracy driven by global market forces • Colocation times up to 30 minutes (1x / hour) • Limited number of small island stations • Cloud Liquid Water • No In Situ Data • Statistical Analyses Carl Mears and Frank Wentz Remote Sensing Systems AMSR Science Team Meeting Huntsville, AL 2-3 June 2010