Download
1 / 1

E N D
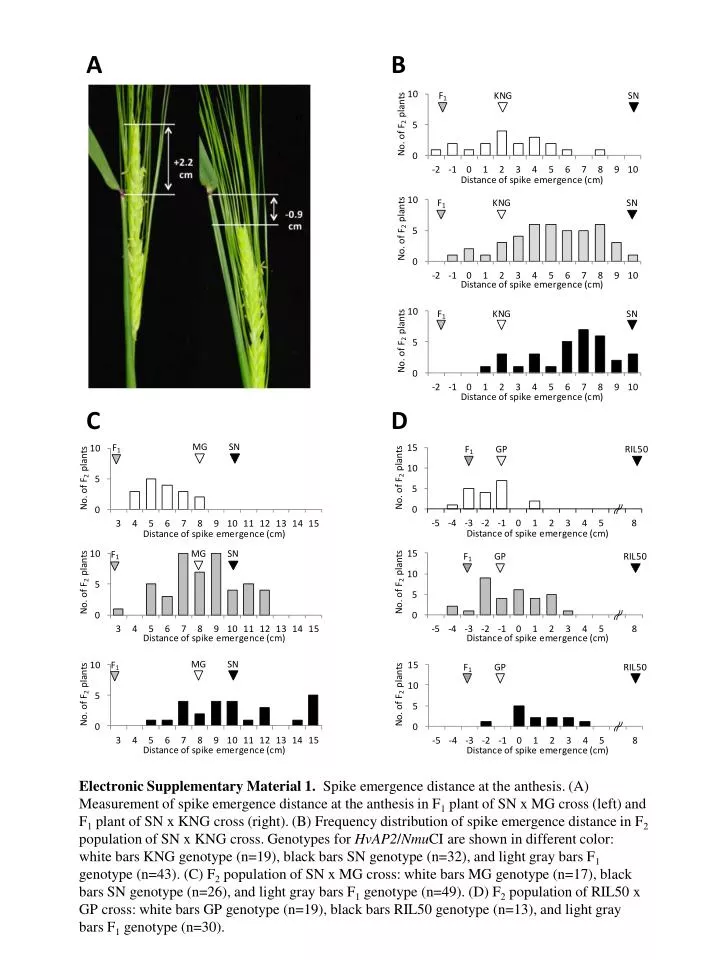
A B C D Electronic Supplementary Material 1. Spike emergence distance at the anthesis. (A) Measurement of spike emergence distance at the anthesis in F1 plant of SN x MG cross (left) and F1 plant of SN x KNG cross (right). (B) Frequency distribution of spike emergence distance in F2 population of SN x KNG cross. Genotypes for HvAP2/NmuCIare shown in different color: white bars KNG genotype (n=19), black bars SN genotype (n=32), and light gray bars F1 genotype (n=43).(C) F2 population of SN x MG cross: white bars MG genotype (n=17), black bars SN genotype (n=26), and light gray bars F1 genotype (n=49). (D) F2 population of RIL50 x GP cross: white bars GP genotype (n=19), black bars RIL50 genotype (n=13), and light gray bars F1 genotype (n=30).