Download
1 / 50

E N D
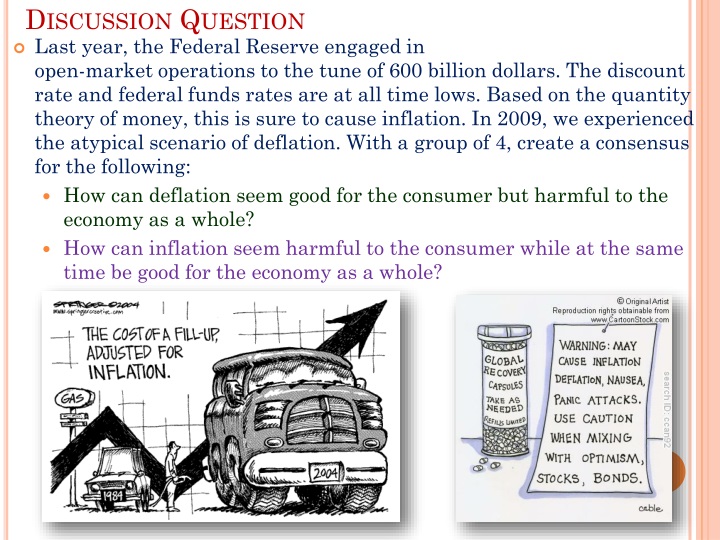
Discussion Question • Last year, the Federal Reserve engaged inopen-market operations to the tune of 600 billion dollars. The discount rate and federal funds rates are at all time lows. Based on the quantity theory of money, this is sure to cause inflation. In 2009, we experienced the atypical scenario of deflation. With a group of 4, create a consensus for the following: • How can deflation seem good for the consumer but harmful to the economy as a whole? • How can inflation seem harmful to the consumer while at the same time be good for the economy as a whole?
Chapter 30 - Money Growth and Inflation • Inflation indicators: • Consumer Price Index (CPI) • GDP Deflator • How do we analyze the price level? • Inflation, disinflation, deflation, hyperinflation, • 3 Theories: • Quantity Theory, Demand-Pull, Cost-Push
Chapter 30 - Money Growth and Inflation • Readdress the effects of Inflation: • Inflation lowers value of money • Each dollar buys a smaller quantity of goods and services • Negatively affects people: • On a fixed income • Without a COLA in their contract • Banks that have offered fixed rates of interest • People that are unaffected/helped: • On a flexible income • With a COLA in their contract • Borrowers that have borrowed at fixed rates of interest
What does a Lack of Inflation Indicate? • Lack of: • Growth • Borrowing • Spending • Expansion
What Can The Fed Do To Boost The Economy? • Expansionary Monetary Policy: • Buy Bonds • Lower interest rates • Increase borrowing • Create inflation (increase in price levels)
Effects of Low Interest Rates • Generally, low interest rates stimulate the economy because the cost of credit is low. • Consumers buy cars and houses. • Businesses expand, invest in capital, etc.
What does Too Much Inflation Indicate? • Large Money Supply • Speculative Bubbles • Over Zealous Growth • Irrationality in the Market • Too much borrowing and spending
How can the fed slow the economy? • The Fed raises interest rates as an effective way to fight inflation. • Consumers pay more to borrow money, dampening spending. • Businesses have difficulty borrowing; unemployment rises.
Money Market Graph Nominal Interest Rate • Interest Rates are high, qd of money is low because people prefer to have their money in a financial assett (bonds, cds, savings,etc.) • Interest rates are low, there is little incentive to save; people prefer to have their money on hand for spending 20% 5% 1% D (Demand for Money) Quantity of Money
Money Market Graph Nominal Interest Rate S (Supply of Money) • Who controls the money supply? • The FED! • The supply curve is perfectly inelastic because the supply of money is not controlled by the interest rate 20% 5% 1% 4 Trillion Quantity of Money
Money Market Graph Nominal Interest Rate • Increase money supply, decrease interest rates (easy money policy, expansionary monetary policy, ramp up borrowing and spending, price levels rise, S1) • Decrease money supply, increase interest rates (tight money policy, contractionary monetary policy, slow down borrowing and increase saving, price levels fall, s2) • How do they do this? • OMOs • RRR • DR/FFR S2 S of Money S1 20% 5% 1% Quantity of Money 4 Trillion
Monetary Policy Buy (Easy Money) Sell (Tight Money)
Contractionary Monetary Policy -$50 Million +$50 Million
MM = 1/RRR 1/.10 = 10 10 x 50 = 500 Million
The Effects of a Monetary Injection • What happens if the Fed doubles the supply of money by through open-market operations? • Quantity Theory of Money – the quantity of money available in the economy determines the value of money and inflation • New equilibrium • Supply curve shifts right • Interest Rates will fall • Price levels increase
a brief look at the adjustment process • Immediate effect of a monetary injection • Creates an excess supply of money • QS>QD of money • People will want to spend excess money • Increase in demand for goods and services • Ultimately, price of goods and services increases as a result of too much money chasing too little amount of goods • Increase in price level (CPI/GDP Deflator)
The classical dichotomy & monetary neutrality • Classical dichotomy – division into two groups; division between the real side of the economy and the monetary side. • Theoretical separation of nominal & real variables • Nominal variables – variables measured in monetary units (not accounting for inflation) • Real variables – variables measured in physical units (accounting for inflation) • GDP, Interest Rates, Income, etc.
Nominal and Real Variables = = • How does this affect consumers? • Reduced purchasing power • Interest rates on money in the bank must keep up with the 100% increase in price levels
The classical dichotomy & monetary neutrality • Monetary neutrality – changes in money supply don’t affect real variables in the long run, only nominal variables in the long run • Long run, nominal variables adjust to match expected inflation • Short run – less than 2 years • Long run – greater than 2 years
Velocity and the quantity equation • Velocity of money (V) • Average number of times a dollar is used to purchase a final product during a year • Speed at which a dollar bill travels from wallet to wallet • How many times is a dollar bill used to pay for a newly produced good or service? • Used to determine the growth of the economy and bank lending • Slow velocity means slow spending, slow lending
Velocity and the quantity equation • Quantity Equation – shows that money supply has a direct, proportional relationship with the price level. • Quantity equation: M × V = P × Y • Quantity of money (M) • Velocity of money (V) • Price Level (P) • GDP (Y) • Classical economists believed that velocity (V) of money was constant, virtually unchanging • Real GDP (Y) was unchanged by increases in quantity of money • Increases in money supply (m) would lead to proportional increases in price level (P)
Velocity of Money Economy has $1000.00 +$500 +$300.00 +$700.00 +$200.00 +$300 $500.00 + $300 + $700 + $200 + $300 = $2000
$500.00 + $300 + $700 + $200 + $300 = $2000 V = Price xGDP(Nominal)/MS V = $400 x 5/1000 V = $2000/1000 V = 2 Quantity Equation M x V = P x Y 1000 x 2 = $400 x 5 2000 = 2000 Monetary Neutrality $10,000 x 2 = $2000 x 5
The Inflation Tax • How does government cause countries experience inflation? • Government Revenue • Taxation – levying taxes, income, sales, excise, property, etc. • Borrowing – selling of bonds • Printing of money • Inflation tax – the revenue the government raises by creating money • No one receives a bill for this tax • Increase in price levels, dollars are less valuable • Tax burden is on everyone that holds money • U.S. – 3% inflation • November 2008 estimated Zimbabwe's annual inflation rate at 89.7 sextillion (1021) percent. By December 2008, annual inflation was estimated at 6.5 quindecillionnovemdecillion percent (6.5 x 10108%, the equivalent of 6 quinquatrigintillion 500 quattuortrigintillion percent, or 65 followed by 107 zeros – one googol 65 million percent).
Fisher Effect • Real interest rate = Nominal interest rate – Inflation rate • Bank posts nominal interest rate of 7% per year and inflation is 3%, real interest rate is 4% per year • Nominal interest rate = Real interest rate + Inflation rate • Fisher effect – developed by Irving Fisher, one-for-one long-run adjustment of nominal interest rate to inflation rate • Nominal interest rate adjusts to expected inflation
Fisher Effect • Nominal Interest rate is 8% • Inflation is 3% • Real Interest Rate = 8% - 3% • r = 5% • Nominal Interest rate is 8% • Inflation is 8% • Real Interest Rate = 8%-8% • r = 0
Unanticipated Inflation • Problems arise when there is unanticipated inflation: • Creditors (lenders) lose and borrowers gain if the lender does not anticipate inflation correctly. • For those who borrow, this is similar to getting an interest-free loan. • When the Fed increases the rate of money growth • Higher inflation rate • Higher price levels
Is Inflation a Problem? • Costs of Inflation (real variables) • Shoeleather costs • Resources wasted when inflation encourages people to reduce their money holdings • More frequent trips to the bank cause your shoes to wear out
Is Inflation a Problem? • Menu costs • Costs of changing prices • Inflation – increases input costs that firms must bear
Is Inflation a Problem? • Relative-price variability & misallocation of resources • Inflation distorts relative prices, consumer and firms decisions become distorted • Markets are not as efficient when they can’t predict inflation
Is Inflation a Problem? • Inflation induced tax distortion • Consumer decisions – stop saving • Markets – less able to set contracts/loans, to their best use
Why Is Inflation a Problem? • Confusion and inconvenience • Money is the yardstick with which we measure economic transactions • The Fed’s job is to ensure the reliability of money • When the Fed increases the money supply, creates inflation • Erodes the real value of the unit of account, which can cause confusion
Why Is Inflation a Problem • Costs of Inflation: • Unexpected inflation • Redistributes wealth among the population • Redistribute wealth among borrowers and lenders
Costs of Inflation Flow Chart – Costs of Inflation, pgs. 677 - 682 Shoeleather Costs Menu Costs Relative-Price Variability and the Missallocation of Resources Inflation-Induced Tax Distortions Confusion and Inconvenience A Special Cost of Unexpected Inflation: Arbitrary Redistributions of Wealth Description - Avoiding inflation - Definition - Bolivia Example (briefly describe) Description - Firm price changes - Definition - Effect of Inflation Description - Eatabit Eatery example - Relative prices and Consumption decisions Description - Discourage saving (capital gains) - Microsoft example - Tax treatment of nominal interest - Solution to the problem Description - Yardstick Metaphor - Increase in Money Supply - Confusion as a result of inflation Description - Unexpected inflation - Sam Student example - Predictable vs. unpredictable inflation - Cost of unexpected inflation
Due Wednesday Chapter 30 Mankiw Practice Chapter 29 MankiwPractice Chapter 30 Free Responses Daily Tens Notes Chapter 30 Terms
Formulas • V = (P × Y)/M • Quantity equation: M × V = P × Y • Real Interest Rate = Nominal interest rate – Inflation rate • Nominal interest rate = Real interest rate + Inflation rate • Political Cartoon: • What do you think the event(s) or issue(s) are that inspired the cartoon? What is the cartoonist trying to portray in the cartoon? • Are there any real people/places in the cartoon? Who are these people? • Are there symbols in the cartoon? What are they and what do they represent? • What is your opinion of the cartoon, do you agree or disagree? Why?
Formulas • Last year, the Federal Reserve engaged in open-market operations to the tune of 600 billion dollars. As a result, the federal funds rate are at all time lows. Based on the quantity theory of money, this is sure to cause inflation. Why would the Fed want to create inflation in the economy? • What should the FED do if the economy begins to expand beyond what is normal inflation? What type of monetary policy is this referred to as? • Describe the three theories of inflation. • Political Cartoon: • What do you think the event(s) or issue(s) are that inspired the cartoon? What is the cartoonist trying to portray in the cartoon? • Are there any real people/places in the cartoon? Who are these people? • Are there symbols in the cartoon? What are they and what do they represent?
Chapter 30 – Application Questions • Why do people hold money? • How will an increase in the interest rate on bonds influence the amount of money that people will want to hold? • How would each of the following influence the quantity of money you would like to hold? • An increase in the interest rate on checking deposits • An increase in the expected rate of inflation • An increase in income • Use the quantity equation for this problem. Suppose the money supply is $200, real output is 1,000 units, and the price per unit of output is $1. • What is the value of velocity? • If velocity is fixed at the value you solved for in part (a), what does the quantity theory of money suggest will happen if the money supply is increased to $400? • Is your answer in part (b) consistent with the classical dichotomy? Explain. • When inflation gets very high, people do not like to hold money because it is losing value quickly. Therefore, they spend it faster. If, when the money supply is doubled, people spend money more quickly, what happens to prices? Do prices more than double, less than double, or exactly double? Why? • Suppose the money supply at the beginning of this problem refers to M1. That is, the M1 money supply is $200. What would the M2 quantity equation look like if the M2 money supply were $500 (and all other values were as stated at the beginning of the problem)?
Chapter 30 - Daily Assignment Questions • Why do people hold money?People - buy things, groceries, house payment, gas, prepare for accidents or medical emergencys, etc. Businesses – pay their workers, buy supplies. • How will an increase in the interest rate on bonds influence the amount of money that people will want to hold?Interest rates make it more costly to hold money. $1000, 10% interest, it would cost you $100 a year. If it is 1%, the cost of holding your money is only $10. • How would each of the following influence the quantity of money you would like to hold? • An increase in the interest rate on checking deposits - Increase incentive to hold your money deposits • An increase in the expected rate of inflation - Reduce your incentive to hold money • An increase in income - Increase your incentive to hold money for consumption purposes
Chapter 30 - Daily Assignment Questions • Use the quantity equation for this problem. Suppose the money supply is $200, real output is 1,000 units, and the price per unit of output is $1. • What is the value of velocity? V = (1,000 x $1)/$200 = 5 • If velocity is fixed at the value you solved for in part (a), what does the quantity theory of money suggest will happen if the money supply is increased to $400? $400 x 5 = $2 x 1,000, prices will double from $1 to $2 • Is your answer in part (b) consistent with the classical dichotomy? Explain. Yes. The classical dichotomy divides economic variables into real and nominal. According to classical economists money affects nominal variables proportionately and has no impact on real variables. In part (b), prices double, but real output remains constant. • When inflation gets very high, people do not like to hold money because it is losing value quickly. Therefore, they spend it faster. If, when the money supply is doubled, people spend money more quickly, what happens to prices? Do prices more than double, less than double, or exactly double? Why?Money has a proportional impact on nominal output if V is constant. If V grows, a doubling of M will cause P to more than double. • Suppose the money supply at the beginning of this problem refers to M1. That is, the M1 money supply is $200. What would the M2 quantity equation look like if the M2 money supply were $500 (and all other values were as stated at the beginning of the problem)? $500 x 2 = $1 x 1,000, M2 velocity is 2.
Money Market Graph • The FED Reserve buys government securities • The FED sells government securities • The FED lowers the RRR • The FED Raises the RRR • Group 5 – Velocity and the Quantity EquationVelocity of money, formula, math example, quantity equation • Group 6 – Five Steps of the Quantity Theory of MoneyList five steps (pg. 672)