Download
1 / 9
110 likes | 420 Vues
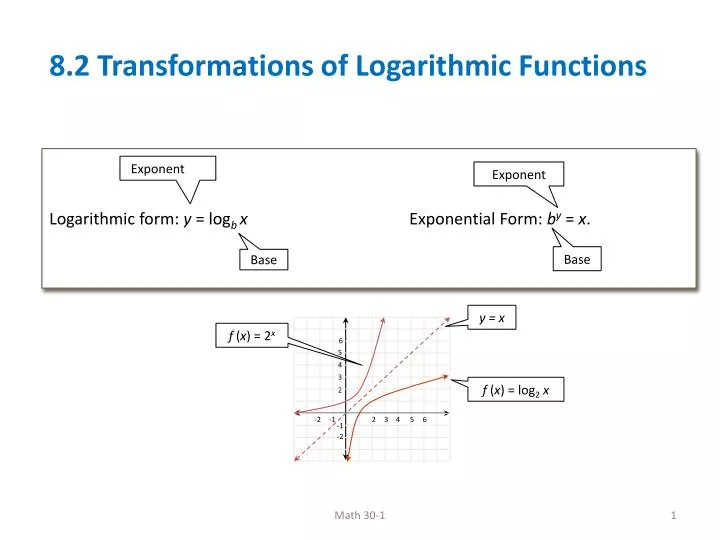
Exponent. Exponent. Base. Base. y = x. f ( x ) = 2 x. 6. 5. 4. 3. f ( x ) = log 2 x. 2. -2. -1. 2. 3. 4. 5. 6. -1. -2. 8.2 Transformations of Logarithmic Functions. Logarithmic form: y = log b x Exponential Form: b y = x. Logarithmic Transformations.

E N D
Exponent Exponent Base Base y = x f (x) = 2x 6 5 4 3 f (x) = log2x 2 -2 -1 2 3 4 5 6 -1 -2 8.2 Transformations of Logarithmic Functions Logarithmic form: y = logbx Exponential Form: by = x. Math 30-1
Logarithmic Transformations Key Points from basic graph to transform include: x-intercept (1, 0) Reflections??? vertical asymptote x = 0 Math 30-1
Sketching Graph of Logarithms Vertical asymptote x = 0 Vertical asymptote x = 0 Vertical asymptote x = 2 x-intercept at 1 x-intercept at 1 x-intercept at 3 Math 30-1
Determine the value of the missing coordinate. The point (32, b) is on the graph of b = 5 The point (a, 3) is on the graph of a = 27 a = 15 The point (a, 4) is on the graph of The point (19, b) is on the graph of b= -3 Math 30-1
Describe the transformations on the graph of y = log2x to become Horizontal stretch by a factor of 1/5 Horizontal translation of 2 units left Vertical translation of 3 units up The Vertical Asymptote , x = 0 translates to The domain of the image graph is Math 30-1
The graph of y = log x is transformed into the graph of y + 3 = log(x - 6) by a translation of 6 units __i__ and 3 units _ii_. The statement above is completed by the information in row For the graph of , where 0 < b < 1, the domain is Math 30-1
The red graph can be generated by stretching the blue graph of y = log4x. Write the equation that describes the red graph. y = log44x The red graph can be generated by stretching and reflecting the graph of y = log4x. Write the equation that describes the red graph. y = -3log4x Math 30-1
The solid graph can be generated by translating the dashed graph of y = log4x. Write the equation that describes the solid graph. y = log4(x)+1 The graph of y = log2x has been vertically stretched about the x-axis by a factor of 3 , horizontally stretched about the y-axis by a factor of 1/5 , reflected in the x-axis, and translated of 7 units left and 2 units up. Write the equation of the transformed function in the form y= a log2 (b(x - h) + k. • y = -3 log2(5(x + 7) + 2 Math 30-1
Assignment Page 389 1, 2, 4a,c, 5b,d, 6a,c, 7, 8b, 9, 10, 13, 14, 16a Math 30-1