Download
1 / 38
380 likes | 498 Vues
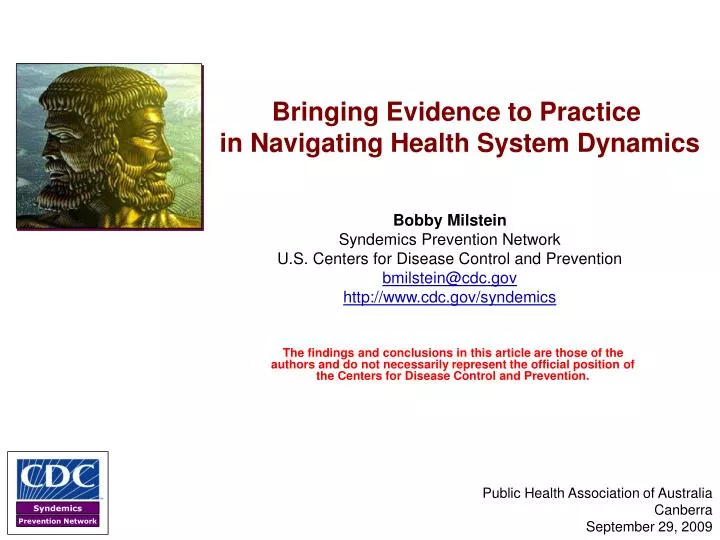
Bringing Evidence to Practice in Navigating Health System Dynamics. Bobby Milstein Syndemics Prevention Network U.S. Centers for Disease Control and Prevention bmilstein@cdc.gov http://www.cdc.gov/syndemics. Public Health Association of Australia Canberra September 29, 2009.

E N D
Bringing Evidence to Practice in Navigating Health System Dynamics Bobby MilsteinSyndemics Prevention NetworkU.S. Centers for Disease Control and Preventionbmilstein@cdc.govhttp://www.cdc.gov/syndemics Public Health Association of Australia Canberra September 29, 2009 The findings and conclusions in this article are those of the authors and do not necessarily represent the official position of the Centers for Disease Control and Prevention.
The Scope and Quality of Evidence/Recommendations for Health Action is Expanding…Very Quickly
Enacting Recommendations Raises Many Questions Years of Life Lost 40 M 30 M 20 M Plausible Futures (Policy Experiments) 10 M 0 1990 2000 2010 2020 2030 2040 Dynamic Hypothesis (Causal Structure) Dynamics What to do first (or together)? Likely consequences? Costs? Time-frame? How to catalyze action? System Homer JB. Why we iterate: scientific modeling in theory and practice. System Dynamics Review 1996;12(1):1-19.
System Dynamics ModelingDynamic Modeling for Complex Policy Environments • Origins • Jay Forrester, MIT, Industrial Dynamics, 1961 (“One of the seminal books of the last 20 years.”-- NY Times) • Population health applications starting mid-1970s • Good at Capturing • Differences between short- and long-term consequences • Time delays (e.g., asymptomatic periods, time to detect/respond) • Accumulations (e.g., prevalences, resources, attitudes) • Behavioral feedback (reactions by various actors) • Nonlinear causal relationships (e.g., threshold effects, saturation effects) • Differences in goals/values among stakeholders Background References on System Dynamics Modeling Forrester JW. Industrial Dynamics. Cambridge, MA: MIT Press; 1961. Sterman JD. Business dynamics: systems thinking and modeling for a complex world. Boston, MA: Irwin McGraw-Hill, 2000. Sterman JD. Learning from evidence in a complex world. American Journal of Public Health 2006;96(3):505-514. Homer JB, Hirsch GB. System dynamics modeling for public health: background and opportunities. AJPH 2006;96(3):452-458. Homer JB, Oliva R. Maps and models in system dynamics: a response to Coyle. System Dynamics Review 2001;17(4):347-355. Richardson GP, Homer JB. System dynamics modeling: population flows, feedback loops, and health. NIH/CDC Symposia on System Science and Health; Bethesda, MD. August 30, 2007. Available at <http://obssr.od.nih.gov/news_and_events/lectures_and_seminars/systems_symposia_series/system_symposium_four/systems_symposium_four.aspx>. Milstein B. Hygeia's constellation: navigating health futures in a dynamic and democratic world. Atlanta, GA: Syndemics Prevention Network, Centers for Disease Control and Prevention; April 15, 2008. <http://www.cdc.gov/syndemics/monograph/index.htm>
A Model Is… They help us understand, explain, anticipate, and make decisions An inexact representation of the real thing “All models are wrong, some are useful.” -- George Box Sterman JD. All models are wrong: reflections on becoming a systems scientist. System Dynamics Review 2002;18(4):501-531. Available at <http://web.mit.edu/jsterman/www/All_Models.html> Sterman J. A sketpic's guide to computer models. In: Barney GO, editor. Managing a Nation: the Microcomputer Software Catalog. Boulder, CO: Westview Press; 1991. p. 209-229. <http://web.mit.edu/jsterman/www/Skeptic%27s_Guide.html>
Simulation and “Double-Loop Learning” Strategy, Structure, Mental Decision Rules Models Real World • Unknown structure • Dynamic complexity • Time delays • Impossible experiments Virtual World • Known structure • Controlled experiments • Enhanced learning • Implementation • Game playing • Inconsistency • Short-term focus • Selected • Missing • Delayed • Biased • Ambiguous Information Decisions Feedback • Inability to infer dynamics from mental models • Misperceptions • Unscientific • Biases • Defensiveness Sterman JD. Learning in and about complex systems. System Dynamics Review 1994;10(2-3):291-330. Sterman JD. Business dynamics: systems thinking and modeling for a complex world. Boston, MA: Irwin McGraw-Hill, 2000.
Overall Health Protection Enterprise SD Identified as a Promising Methodology for Health System Change Ventures Upstream-Downstream Dynamics Neighborhood Transformation Game HealthBound Policy Simulation Game National Health Economics & Reform Syndemics Modeling Diabetes Action Labs Fetal & Infant Health Obesity Overthe Lifecourse Local Context for Chronic Diseases (PRISM) Selected Health Priority Areas Selected Examples from CDC’s Growing Portfolio of Simulation Studies for Health System Change 2006 2007 2008 2000 2001 2002 2003 2004 2005 Centers for Disease Control and Prevention. Dynamic models. Syndemics Prevention Network, 2009. Available at http://www2.cdc.gov/syndemics/models.htm
Re-Directing the Course of ChangeQuestions of Social Navigation Historical Markov Forecasting Model Data Simulation Experiments in Action Labs Prevalence of Diagnosed Diabetes, United States 40 Where? 30 Million people 20 What? How? • Markov Model Constants • Incidence rates (%/yr) • Death rates (%/yr) • Diagnosed fractions • (Based on year 2000 data, per demographic segment) 10 Trend is not destiny Who? Why? 0 1980 1990 2000 2010 2020 2030 2040 2050 Honeycutt A, Boyle J, Broglio K, Thompson T, Hoerger T, Geiss L, Narayan K. A dynamic markov model for forecasting diabetes prevalence in the United States through 2050. Health Care Management Science 2003;6:155-164. Jones AP, Homer JB, Murphy DL, Essien JDK, Milstein B, Seville DA. Understanding diabetes population dynamics through simulation modeling and experimentation. American Journal of Public Health 2006;96(3):488-494.
Types of Models for Policy Planning & Evaluation Events Time Series Models Describe trends • Increasing: • Depth of causal theory • Degrees of uncertainty • Robustness for longer-term projection • Value for developing policy insights • Leverage for change Multivariate Statistical Models Identify historical trend drivers and correlates Patterns Dynamic Simulation Models Anticipate new trends, learn about policy consequences, and set justifiable goals Structure
Prevention Impacts Simulation Model (PRISM) Represents multiple interacting risks and interventions for heart disease, stroke, and related chronic diseases: medical, behavioral, social, environmental Begun in 2007 (now version 2i) and it remains a work-in-progress Engaged subject matter experts from 12 organizations (N~30), and 100s of policy officials, including a deep collaboration with local leaders in Austin, Texas Integrates best available information in a single testable model to support prospective planning and evaluation Explores the likely effects of “local interventions” (i.e., changes in local options/exposures/services that affect behavior and/or health status) To what extent might adverse events and costs be reduced? How can policymakers balance interventions for best effect with limited resources? References: Homer J, Milstein B, Wile K, Trogdon J, Huang P, Labarthe D, Orenstein D. Simulating and evaluating local interventions to improve cardiovascular health. Preventing Chronic Disease, 2009 (in press). Homer J, Milstein B, Wile K, Pratibhu P, Farris R, Orenstein D. Modeling the local dynamics of cardiovascular health: risk factors, context, and capacity. Preventing Chronic Disease 2008;5(2). Available at <http://www.cdc.gov/pcd/issues/2008/apr/07_0230.htm
Prevention Impacts Simulation Model (PRISM)Core Contributors Project Coordinators • Bobby Milstein • Diane Orenstein System Dynamics Modelers • Jack Homer • Kris Wile Economists • Justin Trogdon • Amanda Honeycutt CDC & NIH Subject Matter ExpertsBishwa Adhikari, Nicole Blair, Kristen Betts, Peter Briss, David Buchner, Susan Carlson, Michele Casper, Tom Chapel, Janet Collins, Lawton Cooper, Michael Dalmat, Alyssa Easton, Joyce Essien, Roseanne Farris, Larry Fine, Janet Fulton, Deb Galuska, Kathy Gallagher, Judy Hannon, Jan Jernigan, Darwin Labarthe, Deb Lubar, Patty Mabry, Ann Malarcher, Michele Maynard, Marilyn Metzler, Rob Merritt, Latetia Moore, Barbara Park, Terry Pechacek, Catherine Raspberry, Michael Schooley, Nancy Williams, Nancy Watkins, Howell Wechsler External Subject Matter ExpertsCynthia Batcher, Margaret Casey, Phil Huang, Kristen Lich, Karina Loyo, David Matchar, Ella Pugo, John Robitscher, Rick Schwertfeger, Adolpho Valadez CDC partnered with the Austin (Travis County), Texas, Dept. of Health and Human Services. The model is calibrated to represent the overall US, but is informed by the experience and data of the Austin team, which has been supported by the CDC’s “STEPS” program since 2004.`
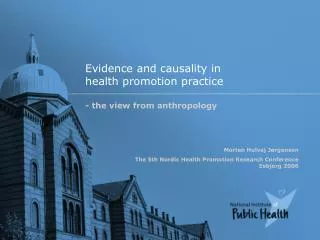
The Popular (and Professional) View of Chronic Disease Challenges is Largely One Headline after Another JunkFood Tobacco PhysicalActivity Obesity Heart Disease & Stroke Cancer Air Pollution WeightLoss Diabetes Healthy Food Health CareCost Stress Sodium MentalHealthServices BloodPressure Alcohol Trans fat PrimaryCare Cholesterol Sleep Emergency & Rehab Care Arthritis
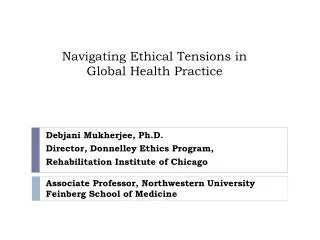
PRISM Situates Multiple Medical, Behavioral, and Environmental Factors into a Single Set of Causal Pathways
PRISM Situates Multiple Medical, Behavioral, and Environmental Factors into a Single Set of Causal Pathways
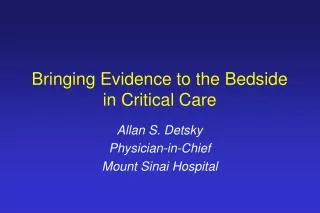
PRISM Also Includes Frontiers for Social Action TOBACCO Reduce air Weight loss Ban smoking in Tax, restrict sales/mktg, pollution services for obese counter-marketing, public places quit services JUNK FOOD Tax, restrict sales/mktg, counter-marketing HEART-HEALTHY FOOD Access, promotion Sodium in food PHYSICAL ACTIVITY Access, promotion, social support, school recs, childcare recs Quality of acute Help services Trans fat Quality and use of and rehab care for distress In food preventive care Local Context for Weight Loss Services Local Context for Tobacco Local Context for Diet Local Context for Physical Activity Local Context for Air Pollution Local Context for Health Care Services Local Context for Mental Health Services Secondhand Air pollution Obesity Smoking Excess exposure smoke calorie diet (PM 2.5) Other deaths and costs attributable to risk factors, and costs of risk factor Heart- management unhealthy diet Chronic Disorders -Hypertension Uncontrolled Cardiovascular Total consequence -High cholesterol chronic disorders Excess events costs -Diabetes sodium diet CVD deaths, disability, Use of quality and costs Physical preventive care inactivity Trans fat Distress consumption
Primary Information Sources Census Population, deaths, births, net immigration American Heart Association & NIH statistical reports Cardiovascular events, deaths, and prevalence National Health and Nutrition Examination Survey (NHANES) Risk factor prevalence by age and sex Diagnosis and control of hypertension, high cholesterol, and diabetes Medical Examination Panel (MEPS), National Health Interview (NHIS), Behavioral Risk Factor Surveillance System (BRFSS), Youth Risk Behavior Survey (YRBS) Medical and productivity costs attributable to risk factors Prevalence of distress in non-CVD and post-CVD populations Primary care utilization Extent of physical activity Research literature CVD risk calculator (Framingham) Relative risks from secondhand smoke, air pollution, obesity, poor diet, inactivity, distress Quality of diet (USDA Healthy Eating Index) Medical and productivity costs of cardiovascular events Effect sizes of behavioral interventions Expert judgment Effect sizes of behavioral interventions Uncertainties are assessed through sensitivity testing
Mapping Information SourcesPhysical Activity Pathway • Physical Inactivity Prevalence52% - 65% (by age) • NHANES, BRFSS, & YRBS • Troiano RP, et al. Med Sci Sports Ex 2008; 40(1):181-188.
Mapping Information SourcesPhysical Activity Pathway • Effective Interventions Increase PA by 40-55% (by age and strategy) • Kahn EB, et al. Am J Prev Med 2002; 22:S73-102.
Mapping Information SourcesPhysical Activity Pathway • RR for obesity onset = 2.6 • Haapanen N, et al. Intl J Obesity 1997: 21:288-296
Mapping Information SourcesPhysical Activity Pathway • RR for distress = 1.3 • Netz Y, Wu M-J, et al. Psyh Aging 2005; 20(2):272-284. .
Mapping Information SourcesPhysical Activity Pathway • RR of inactivity if distressed: 1.6 • Whooley MA, et al. JAMA 2008; 300(20):2379-2388.
Mapping Information SourcesPhysical Activity Pathway • RR for High BP = 1.15RR for High Cholesterol = 1.4 • RR for Diabetes = 1.4 • Ann Med 1991;23(3):319–327. • Intl J Epidemiology 1997; 26(4):739-747. • Canadian Med Assoc J 2000;163(11):1435-1440. • Lancet 1991; 339:778-783. • Arch Intern Med 2001; 161:1542-1548.
Mapping Information SourcesPhysical Activity Pathway • Modification of theFramingham Risk Calculator • Ex Rev Pharm Out Res 2006;6(4):417-24. • Am Heart J 1991;121(1 Pt 2):293-8. • Am Heart J 2007;153(5):722-31, 31 e1-8. • JAMA 2001;286(2):180-7.
Base Case & Illustrative Intervention Scenarios Base Case (a simple scenario for comparison) • Assume no further changes in the contextual factors that affect risk factor prevalences • Any changes in prevalences after 2004 are due to “inflow/outflow” adjustment process and population aging • Result: Past trends level off after 2004, after which results reflect only slow adjustments in risk factors • Increasing obesity, high BP, and diabetes • Decreasing smoking • Increases in risk factors and population aging lead to eventual rebound in attributable deaths Example Intervention Scenarios (max plausible effects, sustained) • Four clusters of interventions layered to show their partial contribution and combined effects • Services (health care, weight loss, smoking quit, distress)+ Diet & Physical Activity+Tobacco +Air Pollution & Sodium & Trans fat
Illustrative Intervention Scenarios: Maximum Plausible StrengthIndividual Services + Diet & PA +Tobacco +Air Pollution & Sodium & Trans fat Smoking Prevalence (Adults) Obesity Prevalence (Adults) Draft Model Output Draft Model Output 0.4 0.4 0.3 0.3 0.2 0.2 0.1 0.1 0 0 1990 2000 2010 2020 2030 2040 1990 2000 2010 2020 2030 2040 Cardiovascular Events per 1000(CHD, Stroke, CHF, PAD) Deaths from All Risk Factors per 1,000 30 Draft Model Output Draft Model Output 8 22.5 6 15 4 7.5 2 0 0 1990 2000 2010 2020 2030 2040 1990 2000 2010 2020 2030 2040 **if all risk factors=0** Work in Progress, Please do no cite or distribute.
Illustrative Intervention Scenarios: Maximum Plausible StrengthIndividual Services + Diet & PA +Tobacco +Air Pollution & Sodium & Trans fat Years of Life Lost from Attributable Deaths Consequence Costs per Capita (medical costs + productivity) 30 M 6,000 Draft Model Output Draft Model Output 22.5 M 4,500 15 M 3,000 7.5 M 1,500 0 0 1990 2000 2010 2020 2030 2040 1990 2000 2010 2020 2030 2040 **if all risk factors=0** Work in Progress, Please do no cite or distribute.
How are Practitioners Using PRISM? Users (~500) Customized Versions • East Austin, Texas • Mississippi Delta • New Zealand Ministry of Health • U.S. economic stimulus health initiative Nat’l & State Stakeholders • CDC Staff • National Association of Chronic Disease Directors • Directors of Public Health Education • National Institutes of Health (NHLBI, OBSSR) A Few Local Versions • Re-calibrate to areas with different demographics, histories, and current conditions Planning • Engage a wider circle of stakeholders • Situate silos within a system • Prioritize interventions (given tradeoffs/synergies) • Set plausible short- and long-term goals Evaluating • Trace intervention effects through direct, secondary, and summary measures • Extend the time horizon for evaluative inquiry • Establish novel referents for comparison (self-referential counter-factuals)
Conversations Around the Model STRATEGIC PRIORITIES • What’s in the model does not define what’s in the room • Simulations intentionally raise questions to spark broader thinking and judgment • Narrower boundaries tend to be more empirically grounded • Wider boundaries may legitimize “invisible” processes • Boundary judgments follow from the intended purpose and users Local intervention opportunities and costs Other health priorities Community themes and strengths SYSTEM DYNAMICS MODEL Political will Stakeholder relationships Health inequities Researchagenda Available information
Interactive ModelingBuilds Foresight, Experience, and Motivation to Act Expert Recommendations Experiential Learning “Wayfinding”
Imperatives for Protecting Health Typical Current State“Static view of problems that are studied in isolation” Proposed Future State“Dynamic systems and syndemic approaches” “Currently, application of complex systems theories or syndemic science to health protection challenges is in its infancy.” -- Julie Gerberding Gerberding JL. Protecting health: the new research imperative. Journal of the American Medical Association 2005;294(11):1403-1406.
The term epidemic is an ancient word signifying a kind of relationship wherein something is put upon the people Epidemiology first appeared just over a century ago (in 1873), in the title of J.P. Parkin's book "Epidemiology, or the Remote Cause of Epidemic Diseases“ Ever since then, the conditions that cause health problems have increasingly become matters of public concern and public work Epi·demic A representation of the cholera epidemic of the nineteenth century.Source: NIH “The pioneers of public health did not change nature, or men, but adjusted the active relationship of men to certain aspects of nature so that the relationship became one of watchful and healthy respect.” -- Gil Elliot Elliot G. Twentieth century book of the dead. New York,: C. Scribner, 1972. Martin PM, Martin-Granel E. 2,500-year evolution of the term epidemic. Emerging Infectious Diseases 2006. Available from http://www.cdc.gov/ncidod/EID/vol12no06/05-1263.htm National Institutes of Health. A Short History of the National Institutes of Health. Bethesda, MD: 2006. Available from http://history.nih.gov/exhibits/history/ Parkin J. Epidemiology; or the remote cause of epidemic diseases in the animal and the vegetable creation. London: J and A Churchill, 1873.
The term syndemic, first used in 1992, strips away the idea that illnesses originate from extraordinary or supernatural forces and places the responsibility for affliction squarely within the public arena It acknowledges the importance of relationships and signals a commitment to understanding population health as a fragile, dynamic state requiring continual effort to maintain and one that is imperiled when social and physical forces operate in harmful ways Syn·demic Events System Co-occurring Confounding Connecting* Synergism Syndemic Findings from a Bibliometric Analysis of Epidemiology & Public Health Literature 1970-2005 Each member of society is a system citizenin the literal sense of being a (potential) agent of change in the systems of which he or she is a part * Includes several forms of connection or inter-connection such as synergy, intertwining, intersecting, and overlapping
A Field in Transition Modern health policy—and evaluation—are becoming more… • Inter-connected(ecological, multi-causal, dynamic, systems-oriented)Concerned more with leverage than control • Public(broad-based, partner-oriented, citizen-led, inter-sector, democratic) Concerned with many interests and mutual-accountability • Questioning(evaluative, reflexive, critical, practical)Concerned with creating and protecting values like health, equity,dignity, security, satisfaction, justice, wealth, and freedom in both means and ends
Expanding Public Health Science Syndemic Orientation Governing Dynamics CausalMapping Dynamic Modeling Plausible Futures People and Problems in Places Over Time Boundary Critique DemocraticPublic Work Navigational Freedoms “Public health imagination involves using science to expand the boundaries of what is possible.” -- Michael Resnick EpidemicOrientation Milstein B. Hygeia's constellation: navigating health futures in a dynamic and democratic world. Atlanta, GA: Syndemics Prevention Network, Centers for Disease Control and Prevention; April 15, 2008. <http://www.cdc.gov/syndemics/monograph/index.htm>.
Evidence and Action Both Emerge fromBroader Philosophies of Science and Society Positivism • Begins with a theory about the world • Learning through observation and falsification • Asks, “Is this theory true?” Pragmatism • Begins with a response to a perplexity or injustice in the world • Learning through action and reflection (even simulated action can be illuminating) • Asks, “How does this make a difference?” These are conceptual, methodological, and moral orientations, which shape how we think, how we act, how we learn, and what we value Shook J. The pragmatism cybrary. 2006. Available at <http://www.pragmatism.org/>. Addams J. Democracy and social ethics. Urbana, IL: University of Illinois Press, 2002. West C. The American evasion of philosophy: a genealogy of pragmatism. Madison, WI: University of Wisconsin Press, 1989.