Download
1 / 1

E N D
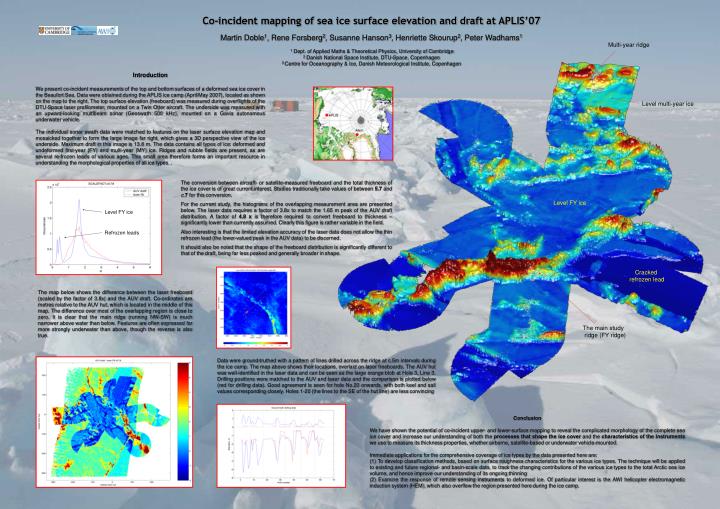
Multi-year ridge Introduction We present co-incident measurements of the top and bottom surfaces of a deformed sea ice cover in the Beaufort Sea. Data were obtained during the APLIS ice camp (April/May 2007), located as shown on the map to the right. The top surface elevation (freeboard) was measured during overflights of the DTU-Space laser profilometer, mounted on a Twin Otter aircraft. The underside was measured with an upward-looking multibeam sonar (Geoswath 500 kHz), mounted on a Gavia autonomous underwater vehicle. The individual sonar swath data were matched to features on the laser surface elevation map and mosaicked together to form the large image far right, which gives a 3D perspective view of the ice underside. Maximum draft in this image is 13.8 m. The data contains all types of ice: deformed and undeformed first-year (FY) and multi-year (MY) ice. Ridges and rubble fields are present, as are several re-frozen leads of various ages. This small area therefore forms an important resource in understanding the morphological properties of all ice types. . Co-incident mapping of sea ice surface elevation and draft at APLIS’07Martin Doble1, Rene Forsberg2, Susanne Hanson3, Henriette Skourup2, Peter Wadhams1 1 Dept. of Applied Maths & Theoretical Physics, University of Cambridge2 Danish National Space Institute, DTU-Space, Copenhagen3 Centre for Oceanography & Ice, Danish Meteorological Institute, Copenhagen Level multi-year ice The conversion between aircraft- or satellite-measured freeboard and the total thickness of the ice cover is of great current interest. Studies traditionally take values of between 5.7 and c.7 for this conversion. For the current study, the histograms of the overlapping measurement area are presented below. The laser data requires a factor of 3.8x to match the 1.65 m peak of the AUV draft distribution. A factor of 4.8 x is therefore required to convert freeboard to thickness – significantly lower than currently assumed. Clearly this figure is rather variable in the field. Also interesting is that the limited elevation accuracy of the laser data does not allow the thin refrozen lead (the lower-valued peak in the AUV data) to be discerned. It should also be noted that the shape of the freeboard distribution is significantly different to that of the draft, being far less peaked and generally broader in shape. Level FY ice Level FY ice Refrozen leads Cracked refrozen lead The map below shows the difference between the laser freeboard (scaled by the factor of 3.8x) and the AUV draft. Co-ordinates are metres relative to the AUV hut, which is located in the middle of this map. The difference over most of the overlapping region is close to zero. It is clear that the main ridge (running NW-SW) is much narrower above water than below. Features are often expressed far more strongly underwater than above, though the reverse is also true. The main study ridge (FY ridge) Data were ground-truthed with a pattern of lines drilled across the ridge at c.5m intervals during the ice camp. The map above shows their locations, overlaid on laser freeboards. The AUV hut was well-identified in the laser data and can be seen as the large orange blob at Hole 3, Line 3. Drilling positions were matched to the AUV and laser data and the comparison is plotted below (red for drilling data). Good agreement is seen for hole No.20 onwards, with both keel and sail values corresponding closely. Holes 1-20 (the lines to the SE of the hut line) are less convincing Conclusion We have shown the potential of co-incident upper- and lower-surface mapping to reveal the complicated morphology of the complete sea ice cover and increase our understanding of both the processes that shape the ice cover and the characteristics of the instruments we use to measure its thickness properties, whether airborne, satellite-based or underwater vehicle-mounted. Immediate applications for the comprehensive coverage of ice types by the data presented here are: (1) To develop classification methods, based on surface roughness characteristics for the various ice types. The technique will be applied to existing and future regional- and basin-scale data, to track the changing contributions of the various ice types to the total Arctic sea ice volume, and hence improve our understanding of its ongoing thinning (2) Examine the response of remote sensing instruments to deformed ice. Of particular interest is the AWI helicopter electromagnetic induction system (HEM), which also overflew the region presented here during the ice camp.