Download
1 / 62
620 likes | 774 Vues
Allograft Nephropathy and Cardiovascular Disease: Important for Graft and Patient Survival – Implications for Diagnosis and Treatment. Matthew R. Weir, M.D. Professor and Director Division of Nephrology University of Maryland School of Medicine. Leading Causes of Graft Failure.

E N D
Allograft Nephropathy and Cardiovascular Disease:Important for Graft and Patient Survival – Implications for Diagnosis and Treatment Matthew R. Weir, M.D. Professor and Director Division of Nephrology University of Maryland School of Medicine
Leading Causes of Graft Failure CVD (also known as death with functioning graft) Allograft Nephropathy Are they related?
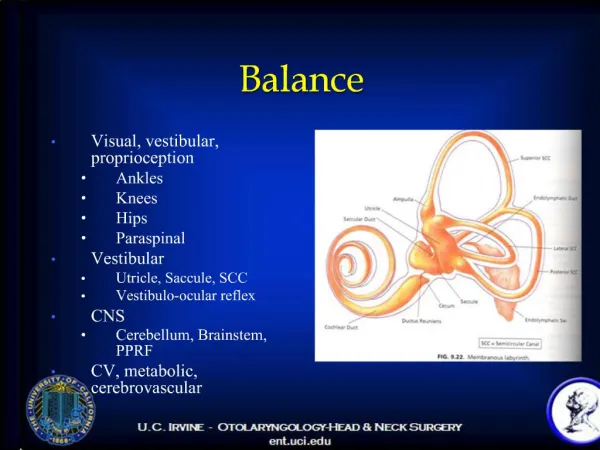
Overview • Cardiovascular risk profile in the kidney transplant recipient vs the general population • Renal autoregulation and microalbuminuria • Risk reduction strategies: focus on blood pressure, cholesterol and glucose • Optimal immunosuppression strategies • Conclusions
Cardiovascular disease is much more common among renal transplant recipients compared to the general population • The greater incidence of CVD is not entirely explained by traditional risk factors, (blood pressure, cholesterol, glucose). Thus, other factors may be involved (immunosuppression, rejection, infection?) Kasiske BL et al. J Am Soc Nephrol 2000;11:1735-1743
Observed and Expected Risk for Ischemic Heart Disease after Renal Transplantation 1.00 0.90 0.80 0.70 10-year survival without IHD 0.60 0.50 0.40 Older Younger Older Younger Older Younger Older Younger --Diabetic-- -Non-Diabetic- Diabetic -Non-diabetic- ----------Smoker---------- ----------Non-Smoker----------
This raises even more questions about the rigor of our approach to CV risk reduction in transplant patients, particular if they have diabetes!
Cardiovascular Risk Profile of the Renal Transplant Recipient • Hypertension • Diabetes • Dyslipidemia • Renal Disease
The Transplant Kidney • Optimal GFR 50-60 ml/min, less in situations of ischemia/reperfusion injury, marginal donors, nephrotoxic drugs or rejection • Risk for hyperfiltration injury? • Pre-existing milieu of hypertension, diabetes and vascular disease
Unmet Need • We need better long-term immunosuppression strategies to avoid the metabolic stresses of diabetes, hypertension and dyslipidemia on both the heart and the kidney and the vascular tree • Biggest focus: corticosteroids calcineurin inhibitors (CNI)
Corticosteroid Withdrawal • Feasible, particularly with newer, more effective drugs and biologicals • Will result in fewer metabolic consequences • Not for everyone! • Perspective: how often does 2.5 – 5 mg/day prednisone cause problems? • Avoidance protocols more successful than tapering: chronic use may condition immune system and increase the risk for rejection.
CNI Withdrawal or Minimization • a more practical issue • define risk: benefit ratio • metabolic improvement cyclosporine: BP, cholesterol, glucose, kidney function tacrolimus: glucose, kidney function • need to be sure no T cell- or antibody-medicated rejection
Decreased Renal Function is a Strong Risk Factor for Cardiovascular Death following Renal Transplantation USRDS Registry First Transplants 1988-1998 Adults Multi-organ Transplants excluded All with functioning graft at one year post transplant (Scr≤4mg/dl) Meier-Kriesche, Kaplan et al. Transplantation 2003
Cardiovascular Death Events in 48,832 KTX by SCr at One Year Post Transplant 100 98 Scr mg/dl @1 /RR 96 <1.3 1.0 1.03 1.19 1.37 1.49 1.67 2.26 1.3-1.4 1.5-1.6 % Cardiovascular death free survival 1.7-1.8 94 1.9-2.1 2.2-2.5 92 2.6-4.0 90 12 24 36 48 60 72 84 96 108 120 0 months post-transplant Meier-Kriesche, Kaplan et al. Transplantation 2003
Renal function is a natural candidate for a surrogate marker of graft loss Era of 1988 to 1994, both acute rejection rates and graft survival rates were improving Functional cadaveric renal allograft survival (censored for death with a functioning graft) after the first year following transplantation, by year of transplant. Hariharan S. NEJM 2000; 342:605. Better intercept or improving slope?
ALTERNATIVE MECHANISMS FOREARLY KIDNEY GRAFT FAILURE Good Function Ccr Accelerated Slope Reduced Intercept Ccr at return to dialysis Time
A shift in conceptual frameworks: challenging traditional assumptions Early function (slope) predicts late function (slope) ie. worse early function results in more aggressive deterioration of function Graft loss is inevitable following kidney transplant as the average slope is decreasing
Summary Renal function can be used as a new endpoint in kidney transplantation interpreted in the form of slopes and intercepts The majority of the “action” occurs after 6 months; baseline factors are poorly predictive of long-term outcomes The stability of renal function after kidney transplantation is improving Loss of graft function is not inevitable following kidney transplantation
Cardiovascular Events byDegree of Albuminuria in HOPE 30 Microalbuminuria threshold All participants With diabetes 25 Without diabetes 20 Incidence (%) 15 10 5 0 1 and 2 3 4 5 6 7 8 9 10 Albumin/Creatinine Ratio Deciles Gerstein HC et al. JAMA. 2001;286:421-426.
Multivariate Hazard Ratios forPrimary Outcome in HOPE Microalbuminuria 1.59 CAD 1.51 Diabetes 1.42 1.4 Creatinine 1.4 mg/dL Male 1.20 WHR (0.1) 1.13 Age (1y) 1.03 Ramipril 0.79 2 0 1 Hazard Ratio HOPE Study Investigators. N Engl J Med. 2000;342:145-153.
Microalbuminuria Resets the Focus on CV Risk Reduction Strategies • BP <130/80 mmHg • Evaluate lipids • Extinguish microalbuminuria • Reduction in dietary salt/saturated fat • Intensify glycemic control • ASA
Allograft Nephropathy • Hypertension/proteinuria/declining kidney function are the hallmarks of this disease process • Need for specific antihypertensive, antiproteinuric approaches? • Modification of immunosuppression
Chronic Rejection of Renal Allografts Impact of Early Events Ischemia/Reperfusion Acute Rejection CMV and Other Infections INJURY LOSS OF NEPHRONMASS Donor Factors Adhesion Molecules, Cytokines, Growth Factors CHRONIC GRAFTDYSFUNCTION
Endothelium Alloantigen-DependentMechanisms Alloantigen-IndependentMechanisms HLA matchingAcute rejectionOngoing subclinical immunologic injury Brain deathIschemia/reperfusion injuryInadequate renal mass(donor age, gender, race, organ size)Hypertension and hyperlipidemiaDrug nephrotoxicityCMV, other infections • Allorecognition APC • Costimulation T Cell Cytokines Macrophage Cytokines Growth factors B Cell Antibodies Effector mechanisms Chronic rejection
Lumenal Obliteration Due to Vasculopathy in Chronic Allograft Nephropathy
Tubulointerstitial Fibrosis and Scarring in Chronic Allograft Nephropathy
Calcineurin inhibitors and hemodynamic effects extracellularmatrix deposition . Ang II TG F- ? apoptosis Direct effect ET-1 Sympathetic tone Thromboxane A2 NO Prostaglandins Prostacyclins CsA Vasoconstriction Renal ischemia and injury interstitialcell proliferation followed byApoptosis Apoptosis > > Proliferation Hypocellular lesions inareas of fibrosis
University of Maryland Clinical Experience Trial in Patients with Allograft Nephropathy • All patients were on triple immunosuppressive therapy: tacrolimus, mycophenolate mofetil and maintenance prednisone therapy. • Patients were asked to discontinue tacrolimus after the first loading dose of sirolimus. • Maintenance dose of sirolimus was adjusted to maintain goal trough level of 8-12 ng/ml. MMF used at 1g BID. Low dose prednisone 2.5-5 mg QD. Wali RK, et al. Am J Transplant 2007;6:1572-1583
Demographics (n=125) Wali RK, et al. Am J Transplant 2007;6:1572-1583
Pre / Post Conversion BUN & Creatinine Wali RK, et al. Am J Transplant 2007;6:1572-1583
Changes in GFR (Nankivell Formula) after Conversion (Δ pre-post GFR ml/min) Wali RK, et al. Am J Transplant 2007;6:1572-1583
Demographic Factors Wali RK, et al. Am J Transplant 2007;6:1572-1583
Kaplan-Meier graph for graft loss:Log Rank p=.0003 1.2 1.0 Δ>16 (n=79) .8 Percentage survival Δ 1-15 (n=39) .6 Δ zero or less (n=7) .4 .2 0.0 0 10 20 30 40 Graft Loss during the follow up Wali RK, et al. Am J Transplant 2007;6:1572-1583
Study Objective To evaluate combination mycophenolate mofetil (MMF) and sirolimus (SRL) as a calcineurin inhibitor (CNI)-free regimen for renal function preservation in renal allograft recipients
Pre-randomization Post-randomization MMF + tacrolimus 30 – 180 D A Y S P O S T - T X MMF + tacrolimus MMF + sirolimus MMF + cyclosporine MMF + cyclosporine MMF + sirolimus Patient screening and enrollment 2 years 1 year Trial Design
Dosing Regimens • Mycophenolate Mofetil • 1 to 1.5 g BID • Sirolimus • 2 to 10 mg loading dose • Maintain trough levels of 5 to 10 ng/mL • Calcineurin Inhibitors/Corticosteroids • According to center practice
Key Inclusion Criteria • Male/female, age 13 to 75 years • Received a primary living or deceased donor renal allograft within the previous 30 to 180 days • Maintained on MMF + CNI (TAC or CsA) with or without corticosteroids for 14 days pre-randomization
Key Exclusion Criteria Corticosteroid-resistant, biopsy-proven acute rejection or treated for acute rejection with antibody therapy within 90 days prior to randomization Corticosteroid-sensitive acute rejection 30 days prior to randomization >1 Biopsy-proven acute rejection prior to study entry SCr >2.5 mg/dL or CrCl <30 mL/min (Cockroft-Gault) at study entry Total cholesterol levels >300 mg/dL or triglycerides >350 mg/dL
Endpoints Primary Mean percent change from baseline to 12 months of measured GFR (cold iothalamate) Secondary Biopsy-proven acute rejection at 12 months Treatment failure at 12 months graft loss death lost to follow-up/withdrawal of consent need to resume CNI therapy dialysis premature withdrawal due to adverse event Safety All adverse events with a focus on hyperlipidemia and new onset diabetes
Patient Allocation (ITT)* Randomized N=298 MMF/SRL N=148 MMF/CNI N=150 Tacrolimus Withdrawal N=122 Cyclosporine Withdrawal N=26 Tacrolimus N=119 Cyclosporine N=31 *81% received tacrolimus and 19% received cyclosporine
Patient Demographics *P = NS for MMF/SRL vs MMF/CNI and for MMF/TAC vs MMF/CsA.
Baseline Characteristics *P = NS for MMF/SRL vs MMF/CNI and for MMF/TAC vs MMF/CsA.
Mycophenolate Mofetil Dose MMF/SRL MMF/CNI Mean Dose (mg) ± SD Post-Randomization Baseline N=140 N=139 1 Month N=114 N=129 6 Months N=116 N=123 12 Months N=122 N=112
Tacrolimus Trough Levels Mean Tacrolimus Concentration ng/mL (± SEM) Post-Randomization Baseline N=106 2 Weeks N=92 6 Months N=97 12 Months N=88
Cyclosporine Trough Levels Mean Cyclosporine Concentration ng/mL (± SEM) Post-Randomization Baseline N=30 2 Weeks N=23 6 Months N=26 12 Months N=26
Sirolimus Trough Levels Mean Sirolimus Concentration ng/mL (± SEM) Post-Randomization Day 7 N=123 1 Month N=112 6 Months N=104 12 Months N=102