Download
1 / 32
330 likes | 447 Vues
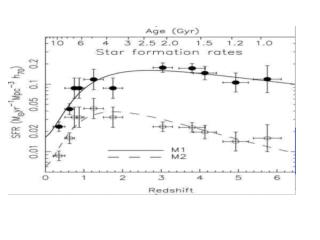
Sensitivity of Ozone Formation To Photons. Sasha Madronich National Center for Atmospheric Research Boulder Colorado USA Mexico City, 14 August 2009. Tropospheric Ozone Formation:.

E N D
Sensitivity of Ozone Formation To Photons Sasha Madronich National Center for Atmospheric Research Boulder Colorado USA Mexico City, 14 August 2009
Tropospheric Ozone Formation: Urban ozone is generated when air containing hydrocarbons and nitrogen oxides is exposed to ultraviolet radiation - Haagen-Smit (1950s)
Mexico City’s O3 Production is VOC-limited, NOx-inhibited WRF-Chem--- sensitivity studies ● observations CAMx--- sensitivity studies Tie et al., 2007 Lei et al., 2007
NOx-VOC Regimes VOC-limited NOx-limited NOx-inhibited Very low NOx: O3 ~ J0.5 [NOx] Very high NOx: O3 ~ J [VOC] / [NOx]
Sensitivity (%/%) of O3 in Mexico City NCAR Master Mechanism box model Madronich, unpubl..
O3 production is always PHOTON-LIMITED Radiative transfer modeling ok for ideal conditions: cloud-free, pollution-free Large uncertainties for realistic conditions, not well modeled Affected by long term trends in aerosols, absorbing gases, clouds Few comprehensive studies on photon-limitation
Quantifying Photolysis Processes Photolysis reaction: AB + hn A + B Photolysis rates: Photolysis frequency (s-1) J = lF(l) s(l) f(l)dl (other names: photo-dissociation rate coefficient, J-value)
CALCULATION OF PHOTOLYSIS COEFFICIENTS J (s-1) = lF(l) s(l) f(l)dl F(l) = spectral actinic flux, quanta cm-2 s-1 nm-1 probability of photon near molecule. s(l) = absorption cross section, cm2 molec-1 probability that photon is absorbed. f(l) = photodissociation quantum yield, molec quanta-1 probability that absorbed photon causes dissociation.
Solar Spectrum O2 and O3 absorb all UV-C (l<280 nm) before it reaches the troposphere UNEP, 2002
Spectral Region ForTropospheric Photochemistry surface, overhead sun Madronich, unpubl..
Typical Vertical Optical Depths, t Direct transmission = exp(-t) Diffuse transmission can be much larger Madronich, unpubl..
Effect of Pollutants on UV Irradiance Model calculations for 21 June, 35 N, noon, pollutants distributed over a 1 km boundary layer Madronich, unpubl..
UV Actinic Flux Reduction Slower Photochemistry Mexico City (T1) Madronich, Shetter, Halls, Lefer, AGU’07
JNO2 Observed/Model_clean March 2006 T1 supersite thin curves = individual days thick blue curve = average Madronich, unpubl..
Aerosol Impacts on Photochemistry NO2 + hn NO + O (at surface) Castro et al. 2001
O3 Suppression from Aerosol (Mexico City) Castro et al. 2001
Vertical Structure of Aerosol EffectsNO2 Photolysis Frequency19N, April, noon, AOD = 1 at 380 nm Castro et al. 2001
Aerosol Single Scattering AlbedoMexico City UV-MFRSR (T1) AERONET (T1) Barnard et al. (CENICA) Corr et al., 2009
DIURNAL CYCLE OF AEROSOL OPTICS 550 nm Paredes-Miranda et al., 2008
UNIFORM CLOUD LAYER • Above cloud: - high radiation because of reflection • Below cloud: - lower radiation because of attenuation by cloud • Inside cloud: - complicated behavior • Top half: very high values (for high sun) • Bottom half: lower values
EFFECT OF UNIFORM CLOUDS ON ACTINIC FLUX Madronich, 1987
SPECTRAL EFFECTS OF PARTIAL CLOUD COVER Crafword et al., 2003
PARTIAL CLOUD COVERBiomodal distributions Crafword et al., 2003
WRF-Chem Regional O3 Prediction Observed daily 1-h maximum O3 for all EPA AIRNOW surface stations in the model domain, 21 July - 4 August 2002. G.A. Grell et al. / Atmospheric Environment 39 (2005) 6957–6975
Correlation coefficient - R scatter mostly from clouds not modeled correctly !? G.A. Grell et al. / Atmospheric Environment 39 (2005) 6957–6975
Mean Bias bias mostly from aerosols not modeled correctly !? G.A. Grell et al. / Atmospheric Environment 39 (2005) 6957–6975
Problems and Opportunities • O3 productions is • sometimes NOx limited • sometimes VOC limited • always photon limited • Pollution affects photon availability (10-30% reductions are not uncommon). • Aerosols and clouds change the vertical gradient of photochemistry • usually brighter above, dimmer below (but not always)
UV properties of aerosols are poorly known • Composition • Size distributions • Morphologies, mixing states • Vertical distribution • VOC-NOx-photon interactions: Photon availability may change NOx-limited transition point: High J O3 Low J NOx
Delay of reactivity: slower urban photochemistry allows more export of precursors for regional oxidants. • Regional photochemistry may be accelerated by scattering aerosols (Dickerson et al., 1997) • Clouds: need improved cloud statistics for parameterizing optical properties. Also, how to deal with model vs. real clouds? • Need evaluation of model J-values with in situ measurements under realistic conditions. Need to demonstrate closure through the vertical extent.