Download
1 / 30
300 likes | 400 Vues
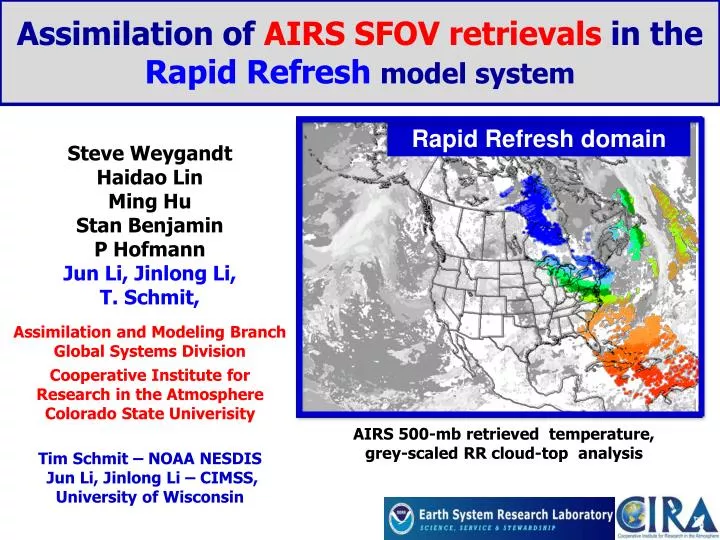
Assimilation of AIRS SFOV retrievals in the Rapid Refresh model system. Rapid Refresh domain. Steve Weygandt Haidao Lin Ming Hu Stan Benjamin P Hofmann Jun Li, Jinlong Li, T. Schmit,. Assimilation and Modeling Branch Global Systems Division Cooperative Institute for

E N D
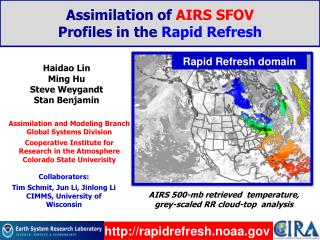
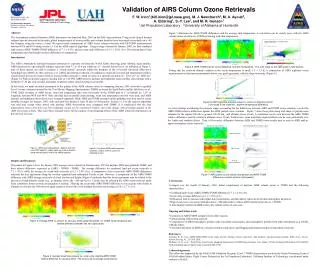
Assimilation of AIRS SFOV retrievals in the Rapid Refresh model system Rapid Refresh domain Steve Weygandt Haidao Lin Ming Hu Stan Benjamin P Hofmann Jun Li, Jinlong Li, T. Schmit, Assimilation and Modeling Branch Global Systems Division Cooperative Institute for Research in the Atmosphere Colorado State Univerisity AIRS 500-mb retrieved temperature, grey-scaled RR cloud-top analysis Tim Schmit – NOAA NESDIS Jun Li, Jinlong Li – CIMSS, University of Wisconsin
Talk Outline • Backgroundon Rapid Refresh system • AIRS SFOV data coverage and assessment • Retro experiment design, impact benchmarking • Initial SFOV temperature experiments • SFOV moisture experiments with bias correction • Bias correction for SFOV temperatures • Ongoing work and future plans
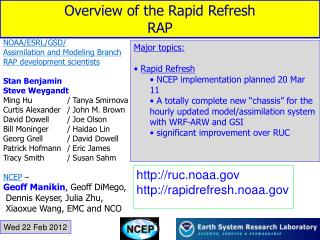
1. Background on Rapid Refresh RUC Rapid Refresh transition • Advancedcommunity codes (ARW and GSI) • Retain key features from RUC analysis / model system • (hourly cycle, cloud analysis, radar DFI assimilation) • Domain expansion consistent fields over all of North America • RAP guidance for aviation, severe • weather, energy applications • Status /implementation • NCO 30-day evaluation ongoing • NCEP operational implementation planned for 13 March 2012 Rapid Refresh13 RUC-13
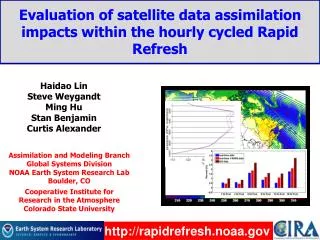
Rapid Refresh Real-time system Partial cycle atmospheric fields – introduce GFS information 2x per day Fully cycle all LSM fields Data types – counts/hr Rawinsonde (12h) 150 NOAA profilers 35 VAD winds ~130 PBL profilers / RASS ~25 Aircraft (V,T) 3500 – 10,000 TAMDAR 200 – 3000 METAR surface 2000 -2500 Mesonet (T,Td) ~8000 Mesonet (V) ~4000 Buoy / ship 200-400 GOES cloud winds 4000-8000 METAR cloud/vis/wx ~1800 GOES cloud-top P,T 10 km res. satellite radiance ~5,000 Radar reflectivity 1 km res. 1-hr fcst 1-hr fcst 1-hr fcst Back- ground Fields Analysis Fields 3DVAR 3DVAR Obs Obs Time (UTC) 11 12 13
2. AIRS SFOV Data Assessment • Launched in May 2002 on NASA Earth Observing System (EOS) polar-orbiting Aqua platform • Twice daily, global coverage • 13.5 km horizontal resolution (Aumann et al. 2003) • 2378 spectral channels (3.7-15.4 µm) • Single Field of View (SFOV) soundings are derived using CIMSS physical retrieval algorithm (Li et al. 2000) • Clear sky only soundings
AIRS SFOV Coverage in RAP 500 mbTemperature8 May 2010 06Z 18Z 00Z 09Z 03Z 12Z 21Z 15Z 06Z
Compare AIRS SFOV with Raobs Conditions for matched profiles: 3-h time window, less than 15 km horizontal distance under clear-sky 3 SFOV data sets obtained from UW CIMSS: V1 – first set V2 – improved V3 – best set Temp RMS Temp bias Improvements in SFOV retrievals has lead to more positive forecast impact All results Shown from V3 Mixing Ratio RMS Mixing Ratio bias
Compare AIRS SFOV with Raobs Raob SFOV
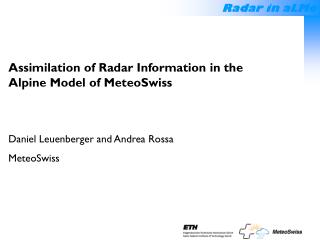
3. Experiment Design / Benchmarking Assimilate full mix of observations • 9 day retro period (8-16 May 2010) • Use 3-h cycle, no partial cycling • Benchmark against R/T and perform raob denial 1-hourly R/T RUC 3-hourly RR retro 1-hourly RR retro (partial cycle) 12-h fcst wind RMS Error (100-1000 mb mean) 3-h RR retro cycle results as expected -- 1-h RR slightly better -- 3-h RR similar to R/T RUC Raob denial results closely match previous OSE study
4. Initial SFOV T Experiments Variations in details of SFOV T assimilation 200 400 600 800 1000 Temperature error variance CNTL – std obs- No AIRS SFOV FULL T – std. obs + SFOV T (50-1000 mb) MID T – std. obs + SFOV T (400-800 mb) DBL Err – std. obs + SFOV T (400-800 mb) 2X standard temperature error variance THIN – thinning 60-km horiz., 50 mb vert. NEW T DATA – 60-km horiz, 50 mb vert. 2X std. error (400-800 mb) NEW T QC– Reject for abs(O-B) > 4 K 1.5 2 2.5 std obs error 2x obs error
AIRS SFOV Temperature Innovations Before QC Before QC After QC After QC Small bias, QC removes outliers Minor glitch, corrected later
+12-h forecast wind errors (against raobs) CNTL (control run) Conventional data) NEW T (CNTL + AIRS SFOV T) 400-800 mb, 2x std. obs error 60 km/50 mbhoriz/vert thinning NEW T QC (CNTL + SFOV T) Above + reject for abs(O-B) > 4 K V RMS Error (avg. over 18 raob times) SFOV Slightly better some levels Temp bias NEW T
+12-h fcst T and RH errors (against raobs) CNTL (control run) Conventional data) NEW T (CNTL + AIRS SFOV T) 400-800 mb, 2x std. obs error 60 km/50 mbhoriz/vert thinning NEW T QC (CNTL + SFOV T) Above + reject for abs(O-B) > 4 K T RMS Error (avg. over 18 raob times) RH RMS Error (avg. over 18 raob times) SFOV Slightly better some levels • SFOV T assim • Slightly worse • RH forecasts
Histograms of moisture innovations (O-B): radiosonde vs. SFOV retrievals AIRS SFOV Gaussian distribution, small bias Large dry bias, correction needed? Radiosonde Dry Dry Moist Moist Scientific question: Should mean moisture innovation for retrievals restricted to clear air columns be near zero?
AIRS SFOV Moisture Innovations Before QC Before QC 0 After QC After QC Large dry bias, QC removes much data Minor glitch, corrected later 0
Apply bias correction (BC) and gross QC (QC) to AIRS SFOV moisture innovations +5% BC Raw data +15% BC 30% QC +15% BC, 30% QC chosen for retro test +15% BC
Retrospective runs for SFOV moisture with and w/o bias correction (BC) • Control(no SFOV Qv) • conventional data, no SFOV retrieval • SFOV Qv w/o BC (30% gross QC, no bias correct) • Control + water vapor (400-800 mb), using 30% as errors for all levels, rejecting any residual larger than 30%, rejecting all near surface data (under 150 mb period) • SFOV Qv WITH BC (30% QC + 15% bias correct) • Same as “SFOV QV w/o BC” except add bias correction (+15% of first guess saturation specific humidity)
Impact of SFOV moisture on bias relative to radiosonde moisture Control (no SFOV Qv) SFOV Qv w/o bias correct SFOV Qv WITH bias correct 12-h forecast Dry Moist Analysis SFOV bias correction procedure significantly reduces analysis and forecast dry bias
Impact of SFOV moisture on +12-hforecast RMS errors relative to raobs DIFF better worse DIFF Control (no SFOV Qv) Temperature SFOV Qv w/o bias correct Relative Humidity SFOV Qv WITH bias correct 0.0 0.2 K 0.0 2.0 % DIFF SFOV with bias correction better than control for nearly all level and all variables Wind 0.0 0.5 m/s
CPC 24-h precip CNTL vs. SFOV T + Q bc 24-h precip. verif 2 x 12h fcst ending 12z 13 May 2011 Verified on common 13-km grid observed Miss FA Hit Thrs 0.50 CSI .53 Bias 1.33 0.5” theshold Thrs 0.50 CSI .57 Bias 1.30 CNTL SFOV T+Q bc
Summary of Moisture Experiments • SFOV moisture innovations have dry bias compared with the background, also non-Gaussian distribution -- Dry innovation bias more pronounced at low levels -- Analsyis with SFOV moisture dry compared to raobs • Bias correction (BC) and gross quality control (QC) check applied to the SFOV moisture data Improved innovation distribution Greatly reduced dry bias in relative humidity for analysis and forecast Significant improvement in relative humidity forecast skill from inclusion of bias correction With BC and QC, SFOV moisture data improve forecasts for nearly all fields and levels
+3h fcst T bias (vs. raobs) – diurnal aspects 09z + 3h 21z + 3h Best T CNTL Best T 00z CNTL 12z Cool Warm Cool Warm 09z 576 mb May 08 Temp (O-B) 21z 576 mb May 08 Temp (O-B)
Overall T bias (vs. raobs) – no diurnal aspects Comparison of SFOV T to radiosonde data +3h fcst T bias (00z,12z) V7 best T cooling V3 cntl warming Cool Warm Cool Warm • Correspondence between raob comparison, fcst impact • Overall average masks diurnal signal • Model bias as well as observation bias
Time height X-section of horizontal avg. SFOV T innovation (O-B) | | | | | | | | | | 00z 00z 00z 00z 00z 00z 00z 00z 00z 00z Time (days – 3 hourly profiles)
Diurnal aspect to horizontal avg. SFOV T (O-B) AK / Grnlnd Eastern NA Western NA/AK --- (north) Eastern NA Central NA Western NA/AK West of AK
Diurnal aspect to horizontal avg. SFOV T (O-B) AK / Grnlnd Eastern NA Western NA/AK --- (north) Eastern NA Central NA Western NA/AK West of AK
+3h fcst T bias (vs. raobs) – evaluation of impact of T bias correction 21z + 3h 09z + 3h CNTL T BC SFOV T SFOV T T BC CNTL valid 12z Cool Warm Cool Warm • First attempt at T bias correction • Improvement in mid-level T bias at 12z • Slightly larger departure from CNTL bias at 00z
12-h forecast RMS Error CNTL SFOV T T bias correct
Sample Precipitation Impact CNTL vs. AIRS Ex. 2 24-h precip. verif CPC 24-h precip 2 x 12h fcst ending 12z 13 May 2010 Verified on common 20-km grid observed Miss FA Hit Thrs 1.5 CSI 0.13 Thrs 1.5 CSI 0.17 1.5 ” theshold CNTL SFOV_16
Summary and Future Work • Results so Far • Initial SFOV T assimilation yielded slight improvement after • several modifications (mid-level only, data thinning, • larger observation error, enhanced QC) • SFOV moisture assimilation gives modest forecast improvement • after implementation of simple bias correction / QC algorithm • Analysis of SFOV T innovations revels diurnal bias pattern pattern relative to RAP background, which has its own • (mostly warm) bias relative to observations • Ongoing and future work for 2011-2012 • Initial SFOV T assimilation with simple bias correction shows bias reduction for 12z, but not 00z. • Further evaluation of SFOV T bias (possibly using aircraft data for verification) and refinement of T bias correctuion • Addition assimilation experiments with bias correction, including • nested HRRR runs from RAP with SFOV temp. and moisture