Download
1 / 27
270 likes | 471 Vues
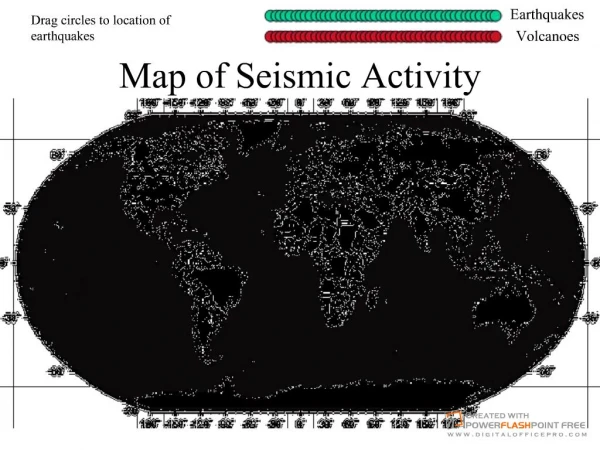
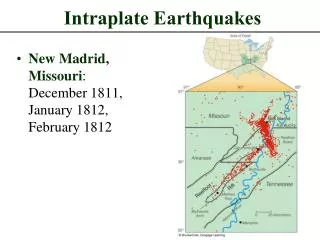
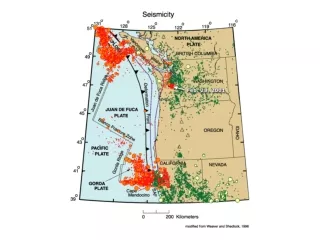
Intraplate Seismicity. Finite element modeling. Introduction. Spatial patterns (Fig. 1) Randomly scattered (Australia) Isolated “seismic zones” (CEUS) Connected seismic belts and networks (N.China) Temporal patterns (Fig. 2) Clustering and then long periods of quiescence (Australia)

E N D
Intraplate Seismicity Finite element modeling
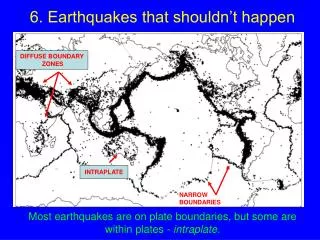
Introduction • Spatial patterns (Fig. 1) • Randomly scattered (Australia) • Isolated “seismic zones” (CEUS) • Connected seismic belts and networks (N.China) • Temporal patterns (Fig. 2) • Clustering and then long periods of quiescence (Australia) • Shanxi graben: Clustering (1303-1800) and then quiescence (need to re-plot the catalog, separate Weihe and Shanxi grabens at least)
Introduction • Questions • What control the different spatial patterns • Are the patterns vary with time-scales • Clustering and long periods of quiescence: different from interplate earthquakes? • For intraplate events: Is there and periodicities? (would be interesting to show that there is no periodicity, at least not as clear as interplate events)
Where can I get the North China earthquake data? Then I can re-plot the figures.
Model • Describe the numerical model and the physics simulated in the model • Mechanisms incorporated include: • Far field boundary loading. • Each element fails when stress reaches strength (an earthquake). • Coseismic and postseismic stress evolution (butterfly patterns)
Case1 1mm/yr Model size is 2000x2000x60km. An elasto-plastic upper layer (20km) and a visco-elastic lower layer (40km). The plate is laterally homogeneous with an initial non-uniform stress distribution, which was generated with random perturbation of crustal strength.
stress evolution in 6,000 years(Horizontally homogeneous rheology) Earthquakes (black dots) occur in high stress regions (red). The stress drops after earthquakes, and increase in interseismic periods.
Results • Case1: randomly scattered earthquakes • Case 2: interaction between seismic zones • Case 3: what follows earthquakes that are not due to continuous loading but are triggered by some mechanism (NMSZ)
5×10²¹ Pa s In very short period (hundred years), the earthquakes appear to be swarms, which are scattered in the region. In a longer period (thousand years), these swarms connect with each other and form belts. In even longer period (tens of thousands of years), the earthquakes are scattered in the whole region.
2×10²⁰ Pa s 5×10²¹ Pa s Low viscosity of lower crust and mantle tends to concentrate seismicity in belts (left), while high viscosity tends to diffuse seismicity (right).
Temporal clustering in regions Failure history of four different regions are shown. They show temporal clustering. The clustered events fail at different locations within each region. These regions are 100kmx100km in size.
Stress evolution at three different points are shown. These stresses are at mesh nodes. Each stress drop represents failure in one of the elements surrounding the node.
Temporal failures at individual locations However, failures at four points (instead of regions) show some periodicity. These points more represent individual fault patches than regions. Thus it represents the cyclical failure of each individual fault patch. These results further indicate the need of local strengthening/weakening for explaining temporal clustering as discussed in case 3.
Case2 1mm/yr Three fault (weak) zones in homogenous ambient crust. Weak zone A (green) has a slightly lower strength than the other two weak zones (B, yellow; C, blue).
Fault interaction B A C Failure of zone A increase stress at zone B. This cause zone B fails earlier than zone C.
Case2 At the beginning, B fails before C. However, B fails after C later. This is because Zone A and Zone C form a favorite failure orientation, which is perpendicular to zone B. (This is clearer in the next slides).
B A C Last 300,000 years Last 60,000 years Weak zones cause seismicity to occur in belts extending from the weak zones. Again, in short period, the earthquakes occur in ‘swarm’. In longer period, these swarms connect and form belts. Last 6,000 years Last 600 years
Time history of failure events at the middle point of each weak zone. They show some periodicity. Again, this result suggest the need of strengthening/weakening for temporal clustering.
Case3 0mm/yr Same setting as Case2, except that loading is stopped after the first earthquake in zone A.
Case 3 • I would design this case to address some of the question for NMSZ (you kind of did, but need better focus): • are the events since 1812 be aftershocks? (spatial pattern and migration of strain energy) • Are the higher strain rates within the NMSZ due to postseismic creeping? • Is there anyway to produced a few clusters of large events (as suggested by paleoseismic data) in the fault zone – assuming high initial strain accumulation, then triggering, perhaps continuous weakening – Zoback’s idea? And then let it comes to the end -> GPS results The first two questions are important for intraplate earthquakes. However, this simple model was specifically designed to explore the clustering and scattering of intraplate earthquakes. Its power is too limited to address the above questions well. For instance, we at least need a nice defined fault zone and a much finer mesh around the zone. So these questions could be left for future more sophisticated model design. This simple model can say something about the third question. For example, continuous weakening of the fault zone can generate clusters of large events. Here we need one more case to test the effect of a weakening event instead of continuous weakening. Then we can see the end of the earthquake cluster.
Case3 Lower layer viscosity: 1×10²¹ Pa s. Time window: 0 – 6000 years. Earthquakes occur repeatedly in weak zone A (period of 500-700 year) if there is strength weakening. Otherwise, these is no repeated earthquakes. After a period of time, Zone B has some triggered earthquakes. Here, far field loading is stopped after the first failure at weak zone A.
Case3 Different weakening types (in upper crust) generate different earthquake sequences. Single weakening event can only general a few repeated earthquakes. While continuously weakening can generate periodic earthquake sequence. After the end of continuous weakening, the recurrence period becomes longer and longer.
Case3 Stress evolution history in each strength weakening type.
Case3 This figure shows the absolute surface velocity at 232 years after an earthquake on Zone A. The maximum absolute velocity is 0.46 mm/yr. The maximum velocity difference across the fault is 0.93 mm/yr. Viscosity of 1×10²¹ Pa s is used for the lower layer.
I plotted the strain rate 230 years after an earthquake in weak zone A, which is calculated from the velocity field in the last slide of the PPT. The maximum strain rate can be as high as 6e-9/yr. Please note, however, this number is dependent on the earthquake size and the lower crust viscosity.
Summary • Higher viscosity of lower crust and upper mantle tend to diffuse seismicity. • Seismicity appear to be scattered swarms in very short time period, connected belts in longer periods, and much diffused in even longer periods. • In a homogenous intraplate region, it naturally develops temporal clusters. However, the earthquakes at each location show some periodicity. The same applies to the case with weak zones. All of these results invoke the need of strengthening/weakening to explain temporal clustering of large earthquakes at individual fault patches. • Failures of weak zones may trigger failure in other weak zones. • Over long terms, the seismicity in weak zones tend to connect to each other. • Without far field loading, continuously weakening can cause repeated earthquakes. • The postseismic surface velocities after >200 years may not be geodetically detectable.