Download
1 / 7
70 likes | 197 Vues
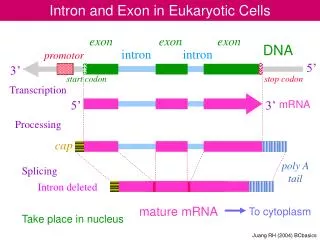
Intron Evolution Supplemental. Kemin Zhou Jan 14, 2011. 0.1. 7.29. Basidiomycota. cryneo1. 7.32. Agaricomycetes. copci1. 7.89. Lacbi1. 7.21. Tremellomycetes. Pospl1. Sporo1. 6.90. 7.08. Phchr1. Pucciniomycotina. Batde5. 5.9. Agaricomycotina. Chytridiomycota. 1.68. 80.

E N D
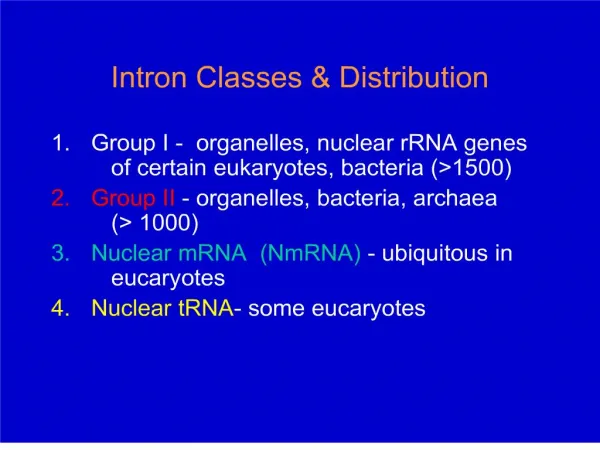
Intron Evolution Supplemental Kemin Zhou Jan 14, 2011
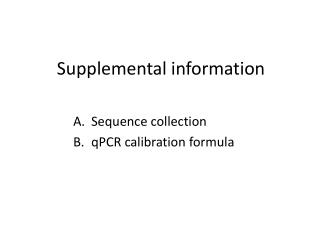
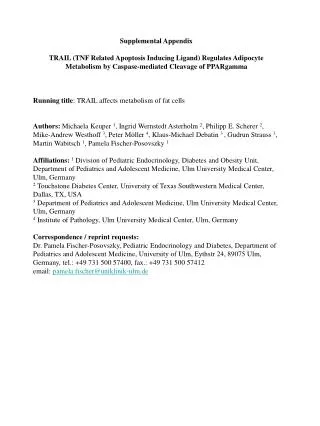
0.1 7.29 Basidiomycota cryneo1 7.32 Agaricomycetes copci1 7.89 Lacbi1 7.21 Tremellomycetes Pospl1 Sporo1 6.90 7.08 Phchr1 Pucciniomycotina Batde5 5.9 Agaricomycotina Chytridiomycota 1.68 80 ustma1 Ustilaginomycotina Mucoromycotina Phybl1 6.18 Pezizomycotina Saccharomycotina 64 Picst3 1.44 Mycfi1 2.49 Eurotiomycetes Dothideomycetes Mycgr1 Necha2 3.33 2.48 Trive1 Ascomycota Trire2 3.35 3.31 Aspni1 Sordariomycetes 3.76 Figure S1.
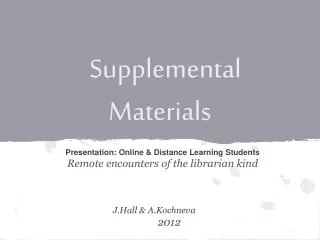
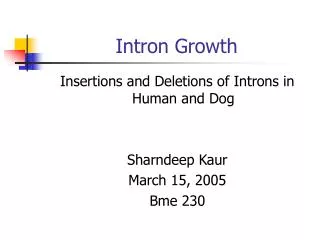
10 10 20 Aspni1 Mycfi1 Mycgr1 8 8 Necha2 40 15 6 6 10 4 4 20 5 2 2 0 0 0 0 0 2000 4000 6000 0 2000 4000 6000 0 2000 4000 6000 0 2000 4000 6000 10 10 10 10 copci1 8 8 8 Picst3 Trire2 Trive1 8 6 6 6 6 4 4 4 4 2 2 2 2 0 0 0 0 Counts 0 2000 4000 6000 0 2000 4000 6000 0 2000 4000 6000 0 2000 4000 6000 10 10 10 40 cryneo1 8 Pospl1 8 8 Lacbi1 Phchr1 30 6 6 6 20 4 4 4 10 2 2 2 0 0 0 0 0 2000 4000 6000 0 2000 4000 6000 0 2000 4000 6000 0 2000 4000 6000 10 10 10 10 Phybl1 Sporo1 8 8 8 8 ustma1 Batde5 6 6 6 6 4 4 4 4 2 2 2 2 0 0 0 0 0 2000 4000 6000 0 2000 4000 6000 0 2000 4000 6000 0 2000 4000 6000 Length (Nucleotides) Figure S2.
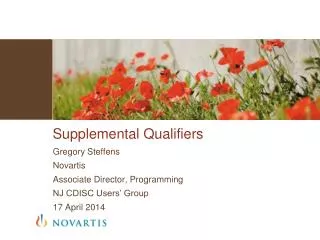
Pospl1 p-value: 0.01845 Mycfi1 18.0 Lacbi1 Phybl1 Necha2 Mycgr1 log Genome Size 17.5 Trive1 Aspni1 copci1 Phchr1 Trire2 Batde5 17.0 Sporo1 ustma1 cryneo1 Picst3 16.5 2 3 4 5 6 7 log Number of RT Figure S3.
Phybl1 Batde5 4.6 ustma1 Mycgr1 Trire2 4.5 Mycfi1 Sporo1 4.4 Pospl1 Trive1 Mean ln (intron length (nt)) 4.3 Picst3 Aspni1 4.2 Lacbi1 Necha2 copci1 cryneo1 4.1 Phchr1 9 10 11 12 13 14 ln (Total RTF Length (nt)) Figure S4.
5 All Mean ln(Intron Length (nt)) Between 4.8 Phylum 4.6 Species 4.4 4.2 4 3.8 3.6 Mycfi1 Trire2 Trive1 Picst3 Phybl1 Mycgr1 Lacbi1 copci1 Aspni1 Batde5 Phchr1 Pospl1 Sporo1 cryneo1 ustma1 Necha2 Figure S5
A Intron Length Difference (SSG-GCAS) 70 60 50 40 30 B Novel 20 10 Intron Length Old 0 With Elements -10 -20 Trive1 Trire2 Picst3 Phybl1 Pospl1 copci1 ustma1 Sporo1 Lacbi1 Phchr1 Mycfi1 Mycgr1 Aspni1 Batde5 y cryneo1 Necha2 z x Time Figure S6.