Download
1 / 13
230 likes | 650 Vues
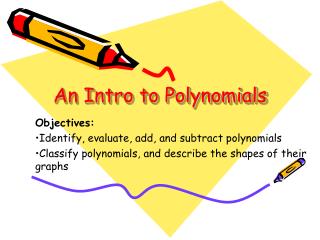
7.1 An Intro to Polynomials. Objectives: Identify, evaluate, add, and subtract polynomials Classify polynomials, and describe the shapes of their graphs. Classification of a Polynomial. n = 0. constant. 3. linear. n = 1. 5x + 4. quadratic. n = 2. 2x 2 + 3x - 2. cubic. n = 3.

E N D
7.1 An Intro to Polynomials Objectives: Identify, evaluate, add, and subtract polynomials Classify polynomials, and describe the shapes of their graphs
Classification of a Polynomial n = 0 constant 3 linear n = 1 5x + 4 quadratic n = 2 2x2 + 3x - 2 cubic n = 3 5x3 + 3x2 – x + 9 quartic 3x4 – 2x3 + 8x2 – 6x + 5 n = 4 n = 5 -2x5 + 3x4 – x3 + 3x2 – 2x + 6 quintic • Objectives: • Identify, evaluate, add, and subtract polynomials • Classify polynomials, and describe the shapes of their graphs
Example 1 Classify each polynomial by degree and by number of terms. Remember to simplify first. a) 5x + 2x3 – 2x2 cubic trinomial b) x5 – 4x3 – x5 + 3x2 + 4x3 quadratic monomial • Objectives: • Identify, evaluate, add, and subtract polynomials • Classify polynomials, and describe the shapes of their graphs
Example 2 Polynomials are used in business to express the cost of manufacturing products. If the cubic function C(x) = 3x3 – 15x + 15 gives the cost of manufacturing x units (in thousands) of a product, what is the cost to manufacture 10,000 units of the product? C(x) = 3x3 – 15x + 15 C(10) = 3(10)3 – 15(10) + 15 C(10) = 3000 – 150 + 15 C(10) = 2865 $2865 • Objectives: • Identify, evaluate, add, and subtract polynomials • Classify polynomials, and describe the shapes of their graphs
Collins Type I Using at least three lines, describe how you identify like terms and why they are important. • Objectives: • Identify, evaluate, add, and subtract polynomials • Classify polynomials, and describe the shapes of their graphs
Example 3 Add (-3x4y3 + 6x3y3 – 6x2 + 5xy5 + 1) + (5x5 – 3x3y3 – 5xy5) -3x4y3 + 6x3y3 – 6x2 + 5xy5 + 1 5x5 - 3x3y3 - 5xy5 5x5 – 3x4y3 + 3x3y3 – 6x2 + 1 • Objectives: • Identify, evaluate, add, and subtract polynomials • Classify polynomials, and describe the shapes of their graphs
Example 4 Subtract. (2x2y2 + 3xy3 – 4y4) - (x2y2 – 5xy3 + 3y – 2y4) = 2x2y2 + 3xy3 – 4y4 - x2y2 + 5xy3 – 3y + 2y4 = x2y2 + 8xy3 – 2y4 – 3y • Objectives: • Identify, evaluate, add, and subtract polynomials • Classify polynomials, and describe the shapes of their graphs
Graphs of Polynomial Functions • You will need: • A Partner • A Graphic Calculator • A Textbook • Page 427 Activity • Answer all questions in your notebook • Each person should record the findings • You have 7 minutes • Objectives: • Identify, evaluate, add, and subtract polynomials • Classify polynomials, and describe the shapes of their graphs
Graphs of Polynomial Functions Graph each function below. 2 1 y = x2 + x - 2 3 2 y = 3x3 – 12x + 4 3 2 y = -2x3 + 4x2 + x - 2 4 3 y = x4 + 5x3 + 5x2 – x - 6 4 3 y = x4 + 2x3 – 5x2 – 6x Make a conjecture about the degree of a function and the # of “U-turns” in the graph. • Objectives: • Identify, evaluate, add, and subtract polynomials • Classify polynomials, and describe the shapes of their graphs
Graphs of Polynomial Functions Graph each function below. 3 0 y = x3 3 0 y = x3 – 3x2 + 3x - 1 4 1 y = x4 Now make another conjecture about the degree of a function and the # of “U-turns” in the graph. The number of “U-turns” in a graph is less than or equal to one less than the degree of a polynomial. • Objectives: • Identify, evaluate, add, and subtract polynomials • Classify polynomials, and describe the shapes of their graphs
Example 5 Graph each function. Describe its general shape. a) P(x) = 2x3 - 1 a curve that always rises to the right b) Q(x) = -3x4 + 2 a U-shape that falls to both sides • Objectives: • Identify, evaluate, add, and subtract polynomials • Classify polynomials, and describe the shapes of their graphs
Test Your Might Sketch the graph of a cubic function that intersects the x-axis at exactly the number of points indicated on your card. Write impossible if appropriate. • Objectives: • Identify, evaluate, add, and subtract polynomials • Classify polynomials, and describe the shapes of their graphs
Homework Lesson 7.1 exercises 17-27 odd, 33, 35, 43, 45, 51-59 odd, 81 • Objectives: • Identify, evaluate, add, and subtract polynomials • Classify polynomials, and describe the shapes of their graphs