Download
1 / 17
170 likes | 269 Vues
Ch 13 Economic Challenges Skeleton (fill in details & explanations). Unemployment Inflation Poverty. Section 1 Unemployment. STGs: Describe/explain Unemployment Frictional Seasonal Structural Cyclical How Full Employment is measured

E N D
Ch 13 Economic ChallengesSkeleton (fill in details & explanations) Unemployment Inflation Poverty
Section 1 Unemployment • STGs: Describe/explain • Unemployment • Frictional • Seasonal • Structural • Cyclical • How Full Employment is measured • Why Full Employment Does NOT mean every worker is employed
Causes of Structural Unemployment • N New technology • N New resources • D Changes in consumer demand • G Globalization • L Lack of education, skills, training
How is Unemployment Measured? • The U.S. Census Bureau does a monthly poll or survey of 50,000 families, asking who is employed and unemployed. • These percentages are then used in the formula on Pg 334, Figure 13.1
Full Employment does NOT=No Unemployment • Why not? Even at “Full Employment Levels” in our economy, there will still be people without jobs because…
Section 1 Quiz What type of unemployment exists when: • Liz is looking for work after staying home to care for elderly parents? • Kim can’t pour cement in Alaska in the winter? • Taxi drivers are out of work because new technology allows people to step into a car, speak their destination, and the car automatically drives itself? • List 3 causes of Structural Unemployment.
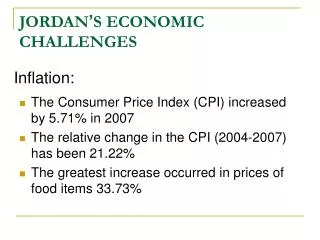
Section 2 Inflation • STGs: Describe/Explain • The Effects of Rising Prices (on Buying Power) • The use of Price Indexes to compare changes in prices over time. (Use CPI to gauge inflation over time) • Causes & Effects of Inflation • Recent Trends in Inflation Rates
Effects of Inflation • Inflation Calculator (BLS.gov) • How much will $15,000 in 1995 buy? • How much will you need in 2012 to buy the same things that you bought for $15,000 in 1995?
The use of Price Indexes • Compare your Buying Power: • From one year to the next • Over a ten year period • When you move from one region in the U.S. to another… Ex: San Diego’s cost of living is 40% higher than the national average.
Causes & Effects of Inflation • Wage-Price Spiral • Demand-Pull Theory • Cost-Push Theory
Recent Trends in Inflation Rates • Using BLS table on CPI from 1920-2012
Section 3 • STGs: Describe, explain… • Who is poor, according to gov’t standards. (What is the poverty threshold for an individual and for a family?) • Causes of poverty • Distribution of Income in the U.S. What percent of the population is poor, middle class or wealthy? • Gov‘t policies designed to combat poverty
Poverty Level or thePoverty ThresholdAnswer the following (leave room for answers): • What is the Poverty Threshold? • Does it stay the same $ amount or does it change from year to year? • How does the Gov’t determine if a person lives at Poverty Level? • How does the Poverty Threshold change with increases in family size? • How is the Poverty Threshold used to determine who is poor enough to get gov’t assistance? (Free Lunch, EBT, Subsidized Housing, College Grants, TANF…)
Causes of Poverty Summarize and explain each cause. • Lack of education/training • Location • Inner City has more poor people percentage wise • Discrimination • Men are paid more than women • Whites are paid more than people of color • Economic downturns • Single Family Households with Children
Income Distribution & the Lorenz Curve • Pg 348: • Lorenz Curve shows the difference between an even income distribution and actual income distribution on a line chart/graph. • The greater the gap between the two – the greater the income inequality • The lowest 20% ( the poorest) of the U.S. population earned only 3.6% of the nation’s income. • The top 20% of wage earners (wealthy) earned 50.6% of the nation’s income.
Antipoverty Policies Fill in the details with summaries from page 350. • E • E • W • TANF – limit of 5 yrs.