Download
1 / 33
330 likes | 441 Vues
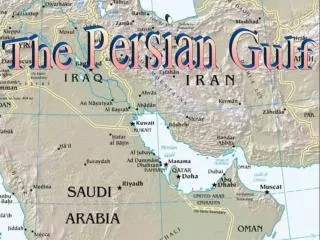
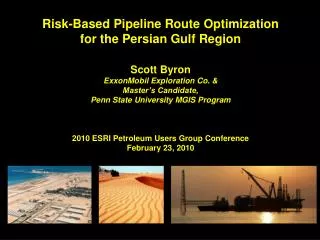
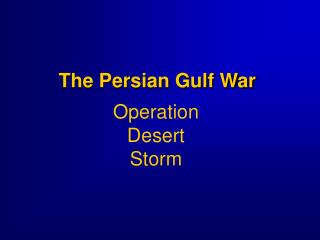
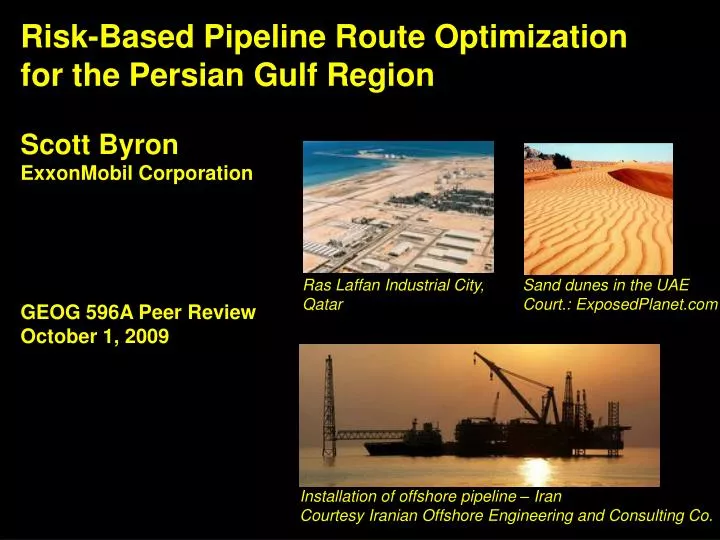
Risk-Based Pipeline Route Optimization for the Persian Gulf Region Scott Byron ExxonMobil Corporation GEOG 596A Peer Review October 1, 2009. Ras Laffan Industrial City, Qatar. Sand dunes in the UAE Court.: ExposedPlanet.com. Installation of offshore pipeline – Iran

E N D
Risk-Based Pipeline Route Optimization for the Persian Gulf Region Scott Byron ExxonMobil Corporation GEOG 596A Peer Review October 1, 2009 Ras Laffan Industrial City, Qatar Sand dunes in the UAE Court.: ExposedPlanet.com Installation of offshore pipeline – Iran Courtesy Iranian Offshore Engineering and Consulting Co.
Presentation Overview • Overview & Background • Workflow diagrams • Analysis factor identification methodology • Data collection & preparation • Proposed Analysis Courtesy: NASA
Project Objectives • Identify three alternative pipeline alignments using common weighting techniques • Identify & weigh analysis factors using risk management approach Qatar – Abu Dhabi – Oman Pipeline Courtesy: Oil & Gas Journal
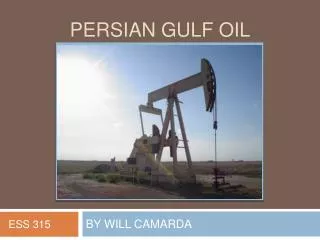
Business Drivers • Increasing demand on Persian Gulf’s hydrocarbon reserves • Pipelines are most economic means of transport • Growing awareness of the benefits of using GIS during project planning
Project Constraints • Must comply with company data restrictions • Must incorporate ExxonMobil’s policies on safety and risk management
Insights from Literature Review • Many examples of terrestrial route optimization • Documented cost and time savings • Variable number of analysis factors • Factors often determined through group consensus • Variety of weighting techniques • Risks consideration implied, only one example is risked based
Regional Overview • Population growth, oil wealth increasing regional hydrocarbon consumption • Pipelines needed to bring new reserves to market • Nearly 80 year development history 2000 Oil Consumption (barrels/1,000 people) Key Map 0.14 – 0.33 Oil Fields Pipelines 33.01 - 65.87 65.88 - 98.73 98.74 - 131.60
Regional Overview • Extreme desert environments • Variable land uses • Variable surface conditions & slope stability • Limited agricultural area supports regional population 2000 Regional Land Use Key Map Forest Semi Desert Shrub/Grasses Rock Outcrop Urban Crops Desert Rivers
Regional Overview • Shallow water depths, high temperatures & salinity • Variable seabed conditions • Major commercial route, constrained by Strait of Hormuz • Growing awareness of environmental issues Persian Gulf Region Topography & Bathymetry Key Map -1,788m -90m 2,863m 0m Max depth of Persian Gulf Hillshade courtesy Carla Wilson
Study Area Selection • Centered on Persian Gulf markets • Disk space use is a consideration • Encompasses a variety of geographic zones Persian Gulf Region Topography & Bathymetry Key Map -1,788m -90m 2,863m 0m Max depth of Persian Gulf Hillshade courtesy Carla Wilson
Projection System Considerations • Analysis requires consistent projection • Distance measurements are a priority • Latitude suggests use of conic projection system • Chose equidistant projection, optimized for study area to minimize distortion Optimized equidistant conic projection
Workflow: Factor Identification Identify Potential Risk Factors Select High Priority Risk Factors Literature review High priority risk factors selected for analysis Team discussion Potential risk factors Formal risk analysis Expert opinion Completed In Progress
Factor Identification Results of process: • 40+ risk factors identified • Lack of expert input • Expect 10 – 20 high priority risk factors • Data availability a problem Partial list of factors
Workflow: Data Collection & Preparation Gather Data Prepare Data Internet search No • Processing steps • Conversion • Merge • Registration • Resampling • Set extent • Transform Transformed & aligned raster layer for each high priority risk factor Is data useful? Yes Global or regional vector, raster, tif & tabular data w/ citations Tent. Completed In Progress
1 km Data Collection & Preparation Data collection considerations: 1) Is the resolution sufficient? 2) Is the data outdated? 2000 population density data Too old? Too coarse?
1 km Data Collection & Preparation Data collection considerations (cont’d): 3) Can the data be accurately registered & digitized? 4) Is the data complete? Good registration control points? No marine data Unregistered seismic hazard map
Data Collection & Preparation Data collection considerations (cont’d): 5) Is the data type suitable? 6) Are value units known? Shipping Traffic Coral Reefs Coral Reefs Point or polygon? Calculations & reclassification
Data Collection & Preparation Data preparation considerations: 1) Raster resampling? 2) Combining marine & terrestrial datasets + = 300m cells 1 km cells Edge effects Which resolution?
Data Collection & Preparation Data preparation considerations (cont’d): 3) How will the coastline be handled? Coastlines need to be aligned Potential for data loss and gaps Northeast Bahrain Is.
Workflows: Weighting Gather Opinions Determine Weights One set of factor weights Simple indexing Formal risk analysis Team discussion Selection Frequency & Degree of Importance data for each high priority risk factor Two sets of factor weights Pair based comparisons Literature review Survey In Progress Pending
Weighting Literature described different weighting methods. Want to compare results. • 1) Simple Weighed Index • High priority risk factors ordered by increasing risk • Index values reflect Probability of Occurrence & Potential Impact scores Increasing risk
Factor A Factor B > Factor C Factor A < Factor C Factor B = Weighting Literature described different weighting methods. Want to compare results. • 2) Pair Based Comparison • All factors compared, one pair at a time • Evaluating Brown & Peterson method (B&P), Analytical Hierarchy Process (AHP)
Factor A Factor B > Factor C Factor A < Factor C Factor C = Weighting Literature described different weighting methods. Want to compare results. • 2) Pair Based Comparison (Cont’d) • B&P relies on Selection Frequency, has no factor categories • AHP relies on Degree of Importance, can use factor categories
Workflow: Analysis Methodology Generate Analysis Surfaces Identify Pipeline Alignments Three weight sets Risk factor layers Least-cost path analysis between provided start and end points Map algebra and reclassification Three alternative pipeline alignments (SWI Optimized, B&P Optimized, AHP Optimized) Three risk weighted analysis surfaces (SWI, B&P, AHP) Pending
References Analysis Methodology Berry, J. K. (2009, August 6). Applying AHP in Weighting GIS Model Criteria. Retrieved from http://www.innovativegis.com/basis/Supplements/BM_Sep_03/T39_3_AHPsupplement.htm Dey P.K. (2001). Integrated approach to project feasibility analysis: A case study. Impact Assessment and Project Appraisal. 19(3), 235-245. Dey P.K. and Gupta S.S. (2000). Decision-support system yields better pipeline route. Oil and Gas Journal. 98(22), 68-73. Longley, P. A., Goodchild, M. F., MaGuire, D. J. & Rhind, D. W. (2005). Geographic Information Systems and Science, 2nd Ed.. London: John Wiley& Sons, Ltd..
References Analysis Methodology (Cont’d) Montemurro D., Barnett S., & Gale T. (1998). GIS-based process helps TransCanada select best route for expansion line. Oil and Gas Journal. 96(25), 63-71. Saaty T.L., Vargas L.G., and Dellmann K. 2003. The allocation of intangible resources: The analytic hierarchy process and linear programming. Socio-Economic Planning Sciences. 37 (3):169-184. Pipelines Braestrup, Mikael W. Design and Installation of Marine Pipelines.. Blackwell Publishing. Online version available at: http://knovel.com.ezaccess.libraries.psu.edu/web/portal/browse/display?_EXT_KNOVEL_DISPLAY_bookid=1384&VerticalID=0
References Pipelines (Cont’d) Guo, Boyun; Song, Shanhong; Chacko, Jacob; Ghalambor, Ali Offshore Pipelines. Elsevier. Online version available at: http://knovel.com.ezaccess.libraries.psu.edu/web/portal/browse/display?_EXT_KNOVEL_DISPLAY_bookid=1258&VerticalID=0 Data Global Seismic Hazard Program. (2009 August 27). Middle East Hazard Map. Retrieved from: http://www.seismo.ethz.ch/GSHAP/ National Center for Ecological Analysis and Synthesis. (2009, August 2). Commercial Activity (Shipping) Dataset. Retrieved from: http://www.nceas.ucsb.edu/GlobalMarine/impacts
References Data (Cont’d) NationMaster.com. (2009, September 22). Oil Consumption (per Capita) (Most Recent) by Country. Retrieved from: http://www.nationmaster.com/graph/ene_oil_con_percap-energy-oil-consumption-per-capita Tupper, M., Tewfik, A., Tan, M.K., Tan, S.L., The, L.H., Radius, N.J., & Abdullah, S. (2009, September 2) ReefBase: A Global Information System on Coral Reefs [Online]. Retrieved from: http://www.reefbase.org United Nations Environmental Program. (2009, August 18). Global Environment Outlook (GEO) Data Portal. Retrieved from: http://geodata.grid.unep.ch/ United States Geological Survey. (2009, September 2). Earthquake Hazards Program: Epicenters Database. Retrieved from: http://neic.usgs.gov/neis/epic/epic_rect.html World Database on Protected Areas. (2009, August 5). Annual Release 2009 Dataset. Retrieved from: http://www.wdpa.org/Default.aspx
References Data (Cont’d) World Wildlife Fund. (2009, August 21). Global Lakes and Wetlands Database. Retrieved from: http://www.worldwildlife.org/science/data/item1877.html