Download
1 / 32
320 likes | 330 Vues
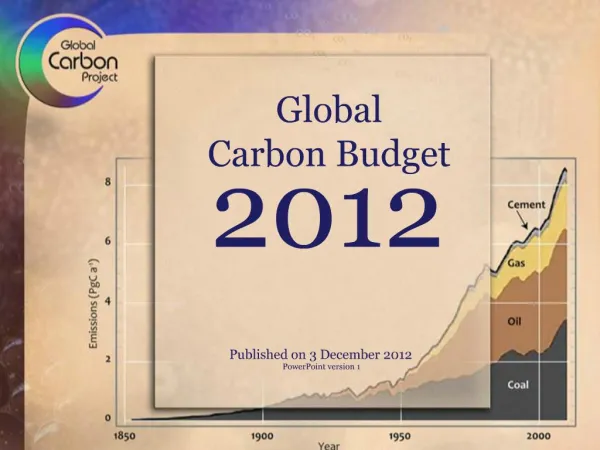
Global Methane Budget. Published on 12 December 2016. 2016. PowerPoint version 1.0 (released 12 December 2016). The Global Methane budget for 2000- 2012.

E N D
Global Methane Budget Published on 12 December 2016 2016 PowerPoint version 1.0 (released 12 December 2016) The Global Methane budget for 2000-2012
The work presented here has been possible thanks to the enormous observational and modeling efforts of the institutions and networks below Acknowledgements • Atmospheric CH4 datasets • NOAA/ESRL (Dlugokencky et al., 2011) • AGAGE (Rigby et al., 2008) • CSIRO (Francey et al., 1999) • UCI (Simpson et al., 2012) • Top-down atmospheric inversions • TM5-4DVAR (Bergamaschi et al., 2009) • LMDZ-MIOP (Pison et al., 2013) • CarbonTracker-CH4 (Bruhwiler et al., 2014) • TM5-4DVAR (Houweling et al., 2014) • LMDZt-SACS (Locatelli et al., 2015) • NIESTM (Saeki et al., 2013; Kim et al., 2011) • ACTM (Patra et al., 2016) • GELCA (Ishizawa et al., 2016; Zhuralev et al., 2013) • Bottom-up modeling • Description of models contributing to the Atmospheric Chemistry and Climate Model • Intercomparison Project (ACCMIP, Lamarque et al., 2013; Voulgarakis et al., 2013; Naik et al., 2013) • Bottom-up studies data and modeling • CLM 4.5 (Riley et al., 2011; Xu et al., 2016) • CTEM (Melton and Arora, 2016) • DLEM (Tian et al., 2010;2015) • JULES (Hayman et al., 2014) • LPJ-MPI (Kleinen et a., 2012) • LPJ-wsl (Hodson et al, 2011) • LPX-Bern (Spahni et al., 2011) • ORCHIDEE (Ringeval et al., 2011) • SDGVM (Woodward and Lomas, 2004) • TRIPLEX-GHG (Zhu et al., 2104; 2015) • VISIT (Ito ad Inatomi, 2012) • GFEDv3 (Van der Werf et al., 2010) • GFEDv4s (Giglio et al., 2013) • GFASv1.0 (Kaiser et al., 2012) • FINNv1 (Wiedinmyer et al., 2011) • IIASA (Höglund-Isaksonn, 2012; Klimont et al., 2016) • EPA, 2011; 2012 • EDGARv4.2FT 2010 and FT2012 (EDGARv4.2, 2013; 2014) • FAO (Tubiello et al., 2013) Full references provided in Saunois et al. 2016, ESSD
Contributors:81people| 53organisations| 15countries Scientificcontributors : Marielle SaunoisFrance | Philippe Bousquet France | Ben PoulterUSA | Anna PeregonFrance | Philippe CiaisFrance | Josep G. CanadellAustralia| Edward J. DlugokenckyUSA | Giuseppe EtiopeItaly | David BastvikenSweden | Sander Houweling The Netherlands | Greet Janssens-MaenhoutItaly | Francesco N. TubielloItaly | Simona CastaldiItaly | Robert B. Jackson USA | MihaiAlexeItaly | Vivek K. AroraCanada| David J. BeerlingUK | Peter BergamaschiItaly | Donald R. Blake USA | Gordon BrailsfordNew Zealand| Victor BrovkinGermany | Lori BruhwilerUSA | KristoferCoveyUSA | Cyril CrevoisierFrance | Patrick CrillSweden | KristoferCoveyUSA | Charles Curry Canada | Christian FrankenbergUSA | Nicola GedneyUK | Lena Höglund-IsakssonAustria | Misa IshizawaJapan | AkihikoItoJapan | Fortunat Joos Switzerland| Heon-SookKim Japan | Thomas KleinenGermany | Paul KrummelAustralia| Jean-François Lamarque USA | Ray LangenfeldsAustralia | Robin Locatelli France | ToshinobuMachidaJapan | ShamilMaksyutovJapan | Kyle C. McDonald USA | Julia Marshall Germany | Joe R. Melton Canada | Isamu MorinoJapan | VaishalaNaikUSA | Simon O’DohertyUK | Frans-Jan W. Parmentier Sweden | Prabir K. PatraJapan | ChanghuiPeng Canada | ShushiPeng China | Glen P. Peters Norway | Isabelle Pison France | Catherine PrigentFrance | Ronald PrinnUSA | Michel RamonetFrance | William J. Riley USA | MakotoSaitoJapan | Monia Santini Italy | Ronny Schroeder USA | Isobel J. Simpson USA | Renato SpahniSwitzerland | Paul Steele Australia| AtsushiTakizawaJapan | Brett F. ThorntonSweden | Hanqin Tian USA | YasunoriTohjimaJapan | Nicolas ViovyFrance | ApostolosVoulgarakisUK | Michiel van WeeleThe Netherlands | Guido van der WerfThe Netherlands| Ray Weiss USA | Christine WiedinmyerUSA | David J. Wilton UK | Andy Wiltshire UK | Doug WorthyCanada | Debra B. WunchCanada | XiyanXu USA | YukioYoshida Japan | Bowen Zhang USA | ZhenZhang USA | QiuanZhu China Data visualisation support at LSCE : Patrick BrockmannFrance | Cathy NanginiFrance
Papers http://www.earth-syst-sci-data.net/8/697/2016/ http://iopscience.iop.org/article/10.1088/1748-9326/11/12/120207 Contact: marielle.saunois@lsce.ipsl.fr
Data access http://cdiac.ornl.gov/GCP/methanebudget/2016/ http://www.globalcarbonproject.org/methanebudget
Contacts Global Methane Budget Website http://www.globalcarbonproject.org/methanebudget
All data are shown in teragrams CH4 (TgCH4) for emissions and sinks parts per billion (ppb) for atmospheric concentrations 1 teragram (Tg) = 1 million tonnes = 1×10¹²g 2.78 Tg CH4 per ppb Disclaimer The Global Methane Budget and the information presented here are intended for those interested in learning about the carbon cycle, and how human activities are changing it. The information contained herein is provided as a public service, with the understanding that the Global Carbon Project team make no warranties, either expressed or implied, concerning the accuracy, completeness, reliability, or suitability of the information.
The methane context • After carbon dioxide (CO2), methane (CH4) is the second most important greenhouse gas contributing to human-induced climate change. • For a time horizon of 100 years, CH4 has a Global Warming Potential 28 times larger than CO2. • Methane is responsible for 20% of the global warming produced by all greenhouse gases so far. • The concentration of CH4 in the atmosphere is 150% above pre-industrial levels (cf. 1750). • The atmospheric life time of CH4 is 9±2 years, making it a good target for climate change mitigation Updated to 2012 • Methane also contributes to tropospheric production of ozone, a pollutant that harms human health and ecosystems. • Methane also leads to production of water vapor in the stratosphere by chemical reactions, enhancing global warming. Sources : Saunois et al. 2016, ESDD; Kirschkeet al. 2013, NatureGeo.; IPCC 2013 5AR; Voulgarakis et al., 2013
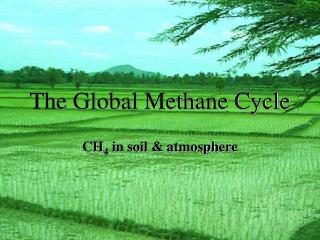
An ensemble of tools and data to estimate the global methane budget Atmospheric observations Bottom-up budget Emission inventories Top-down budget From Kirschke et al., (2013) Long-term trends and decadal variability of the OH sink. ACCMIP CTMs intercomparison. Soil uptake & chlorine sink taken from the literature Suite of eight atmospheric inversion models (TM5-4DVAR (JRC & SRON), LMDZ-MIOP, PYVAR-LMDz, C-Tracker-CH4, GELCA, ACTM, TM3, NIESTM). Ensemble of 30 inversions (diff. obs & setup) Agriculture and waste related emissions, fossil fuel emissions (EDGARv4.2, USEPA, GAINS, FAO). Fire emissions (GFED3 & 4s, FINN, GFAS, FAO). Biofuel estimates Ensemble of 11 wetland models, following the WETCHIMP intercomparison Model for Termites emissions Other sources from literature Ground-based data from observation networks (AGAGE, CSIRO, NOAA, UCI, LSCE, others). Satellite data (SCIAMACHY, GOSAT) Inverse models Methane sinks Biogeochemistry models & data-driven methods
CH4 Atmospheric Growth Rate, 1983-2012 Atmospheric observations • Slowdown of atmosphericgrowth rate before2006 • Resumedincreaseafter 2006 2000-2006: 0.6±0.1 ppb/yr 2007-2012: 5.5±0.6 ppb/yr Source:Saunoiset al. 2016, ESSD (Fig. 1)
Anthropogenic Methane Emissions & RCPs Source: based on Saunois et al. 2016, ERL; Meinshausen et al., 2011 Emission inventories • Atmospheric concentrations (top plot): • Methane concentrations rose even faster in 2014 and 2015, more than 10 ppb/yr. • The recent atmospheric increase is approaching the RCP8.5 scenario • Anthropogenic emissions (bottom plot): • EDGARv4.2 infers an increase in emissions that is roughly twice as fast as EPA and GAINS-ECLIPSE5a before 2010 • Bottom-up inventories are higher than any RCPs scenarios, except RCP8.5 Atmospheric observations
Decadalemissions & sinks
Global Methane Budget 2003-2012 http://www.globalcarbonatlas.org
Mapping of the largest methane source categories Source: Saunois et al. 2016, ESSD (Fig 3); Biogeochemistry models & data-driven methods Emission inventories
Wetland methane emissions Source: Saunois et al. 2016, ESSD; Poulter et al, ERL in review • Wetlands are the largest natural global CH4source • Emission from an ensemble carbon-cycle models constrained with remote sensing surface water and inventory-based wetland area data. • The resulting global flux range for natural wetland emissions is 153–227 TgCH4/yrfor the decade of 2003–2012, with an average of 185 TgCH4/yr. Biogeochemistry models & data-driven methods
Mapping other natural sources Source: Saunois et al. 2016(Fig 4); Etiope (2015), Kirschke et al., 2013) Geological reservoirs based on a data-driven method Termites based on a process-based model (a) Other natural sources not mapped here are freshwater emissions, permafrost and hydrates Biogeochemistry models & data-driven methods
Methane Sinks (2000s) Methane sinks Source : Kirschkeet al. 2013
Global methaneemissions 2003-2012 (TgCH4/yr) Bottom-up budget Top-down budget 185 [40%] Natural wetlands 167 [80%] 195 [15%] 188 [65%] Agriculture & waste Rice 30 [10%] Entericferm & manure106 [20%] Landfills & waste59 [20%] Fossil fuel use 121 [20%] 105 [50%] Coal42 [80%] Gas & oil79 [10%] 34 [55%] Biomass/biofuelburning 30 [30%] 199 [90%] Othernaturalemissions 64 [150%] Freshwaters 122 [100%] Wild animals 10 [100%] Wild fires 3 [100%] Termites 9 [120%] Geological 40 [50%] Oceans 3 [100%] Permafrost 1 [100%] Mean[uncertainty= min-max range %] Mean[uncertainty= min-max range %] Bottom-up budget Processmodels, inventories, data drivenmethods 734 TgCH4/yr[596-884] Top-down budget Atmospheric inversions 559 TgCH4/yr [540-568] Top-down budget Bottom-up budget Mean [min-max range %] Source : Saunois et al. 2016, ESSD
Global MethaneEmissions 2003-2012 Source: Saunois et al. 2016, ESSD (Fig 5) Emission inventories Top-down, left; Bottom-up, right • Global emissions: • 559 TgCH4/yr [540-568] for TD • 734 TgCH4/yr [596-884] for BU • TD and BU estimates generally agree for wetland and agricultural emissions • Estimated fossil fuel emissions are lower for TD than for BU approaches • Large discrepancy between TD and BU estimates for freshwaters and natural geological sources (“other natural sources”) Inverse models Biogeochemistry models & data-driven methods
RegionalMethane Sources (2003-2012) Source: Saunoiset al. 2016 ERL (Fig 2) Top-down budget • 60% of global methane emissions come from tropical sources • Anthropogenic sources are responsible for 60% of global emissions. Inverse models
An interactive view of the methanebudget Source: Saunois et al. 2016 ESSD; Dataviz group of LSCE Emission inventories LINK : http://lsce-datavisgroup.github.io/MethaneBudget/ Top-down budget Bottom-up budget Inverse models Biogeochemistry models & data-driven methods
RegionalMethane Sources (2003-2012) Source: Saunois et al. 2016 ESSD (Fig 7) Emission inventories • Largest emissions in Tropical South America, South-East Asia and China (50% of global emissions) • Dominance of wetlandemissions in the tropics and borealregions • Dominance of agriculture & wastein India and China • Balance between agriculture & waste and fossil fuels atmid- latitudes • Uncertain magnitude of wetlandemissions in borealregionsbetween TD and BU • Chineseemissionslower in TD than in BU, Africanemissionslarger in TD than in BU Inverse models Biogeochemistry models & data-driven methods
Sink changes
Impact of OH change in the methane sink ? • Sustained OH increase can contribute to explain the the stagnation of atmospheric methane (before 2007) • Stagnation or decrease in OH radicals can contribute to explain : • the renewed increase of atmospheric methane since 2007 • The lighter atmosphere in 13C isotope since 2007 Source : Dalsorenet al., 2016 Key point: OH changes could have limited the emission changes necessary to explain the atmospheric methane variations
An acceleratedatmosphericincreasesince2014 1830 ppb reached in 2015 +12.5 ppb/yr in 2014 +10.0 ppb/yr in 2015 Challenging signal to analyse Courtesy, Ed Dlugokencky, NOAA
Highlights • Unlike CO2, atmospheric CH4 concentrations are rising faster than at any time in the past two decades and, since 2014, are now above all but the most greenhouse-gas-intensive scenarios. • A likely major driver of the recent rapid rise in global CH4 concentrations is increased biogenic emissions mostly from agriculture. Tropical regions play the most significant role as contributors to the atmospheric growth. Other sources including emissions from the use of fossil fuels have also increased. • The role of methane sinks has to be further explored as a slower destruction of methane by OH radicals in the atmosphere could have also contributed to the observed atmospheric changes of the past decade. • Methane global emissions were 559 TgCH4/yr [540-570] for 2003-2012 as inferred by an ensemble of atmospheric inversions (top-down approach). • Methane mitigation offers rapid climate benefits and economic, health and agricultural co-benefits that are highly complementary to CO2 mitigation. • Emission estimates from inventories/models (bottom-up approach) show larger global totals because of larger natural emissions. Improved emission inventories and estimates from inland water emissions are needed.
Global Carbon Atlas Explore GHG emissions at the global and country levels, compare among countries, visualize, and download data and illustrations (‘Emissions’ application). Also explore ‘Outreach’ and ‘Research’. Methane section to come. www.globalcarbonatlas.org
Acknowledgements The work presented in the Global Carbon Budget 2015 has been possible thanks to the contributions of hundreds of people involved in observational networks, modeling, and synthesis efforts. Not all of them are individually acknowledged in this presentation for reasons of space (see slide 2 for those individuals directly involved). Additional acknowledgement is owed to those institutions and agencies that provide support for individuals and funding that enable the collaborative effort of bringing all components together in the carbon budget effort. Swiss National Science Foundation, GOSAT Research Computation Facility, National Aeronautic and Space Administration (NASA), National Environmental Science Program – Earth Sciences and Climate Change Hub, LSCE computing support and data analyses, French national facility for high performance computing, European Commission Seventh Framework, Horizon2020, and ERC programme, ESA Climate Change Initiative Greenhouse Gases Phase 2 project, US Department of Energy, Ministry of the Environment, All FAO member countries, Swedish Research Council, Ministry of the Environment(Japan), Research Council of Norway, National Science Engineering Research Council of Canada, China’s QianRenprogram, Commonwealth Scientific and Industrial Research Organization (CSIRO Australia), Australian Government Bureau of Meteorology, Australian Institute of Marine Science, Australian Antarctic Division, NOAA USA, Meteorological Service of Canada, Department of Energy and Climate Change (DECC, UK), Met Office Hadley Centre Climate Programme We also thank the sponsors of the GCP and GCP support/liaison offices
Creative Commons Attribution-NonCommercial-ShareAlike 4.0 International (CC BY-NC-SA 4.0) This deed highlights only some of the key features and terms of the actual license. It is not a license and has no legal value. You should carefully review all of the terms and conditions of the actual license before using the licensed material. Creative Commons is not a law firm and does not provide legal services. Distributing, displaying, or linking to this deed or the license that it summarizes does not create a lawyer-client or any other relationship. This is a human-readable summary of (and not a substitute for) the license. You are free to: Share— copy and redistribute the material in any medium or format Adapt— remix, transform, and build upon the material The licensor cannot revoke these freedoms as long as you follow the license terms. Under the following terms: Attribution— You must give appropriate credit, provide a link to the license, and indicate if changes were made. You may do so in any reasonable manner, but not in any way that suggests the licensor endorses you or your use. What does "Attribute this work" mean? The page you came from contained embedded licensing metadata, including how the creator wishes to be attributed for re-use. You can use the HTML here to cite the work. Doing so will also include metadata on your page so that others can find the original work as well. No additional restrictions — You may not apply legal terms or technological measures that legally restrict others from doing anything the license permits. You do not have to comply with the license for elements of the material in the public domain or where your use is permitted by an applicable exception or limitation. No warranties are given. The license may not give you all of the permissions necessary for your intended use. For example, other rights such as publicity, privacy, or moral rights may limit how you use the material.
References used in this presentation Global Methane Budget 2000-2012, data sources and data files athttp://www.globalcarbonproject.org/methanebudget/ Saunois, M., Bousquet, P., Poulter, B., Peregon, A., Ciais, P., Canadell, J. G., Dlugokencky, E. J., Etiope, G., Bastviken, D., Houweling, S., Janssens-Maenhout, G., Tubiello, F. N., Castaldi, S., Jackson, R. B., Alexe, M., Arora, V. K., Beerling, D. J., Bergamaschi, P., Blake, D. R., Brailsford, G., Brovkin, V., Bruhwiler, L., Crevoisier, C., Crill, P., Kovey, K., Curry, C., Frankenberg, C., Gedney, N., Höglund-Isaksson, L., Ishizawa, M., Ito, A., Joos, F., Kim, H.-S., Kleinen, T., Krummel, P., Lamarque, J.-F., Langenfelds, R., Locatelli, R., Machida, T., Maksyutov, S., McDonald, K. C., Marshall, J., Melton, J. R., Morino, I., Naik, V., O'Doherty, S., Parmentier, F.-J. W., Patra, P. K., Peng, C., Peng, S., Peters, G. P., Pison, I., Prigent, C., Prinn, R., Ramonet, M., Riley, W. J., Saito, M., Sanyini, M., Schroeder, R., Simpson, I. J., Spahni, R., Steele, P., Takizawa, A., Thornton, B. F., Tian, H., Tohjima, Y., Viovy, N., Voulgarakis, A., van Weele, M., van der Werf, G., Weiss, R., Wiedinmyer, C., Wilton, D. J., Wiltshire, A., Worthy, D., Wunch, D. B., Xu, X., Yoshida, Y., Zhang, B., Zhang, Z., and Zhu, Q. (2016): The Global Methane Budget 2000-2012, Earth System Science Data, 8, 1-54, http://dx.doi.org/10.5194/essd-8-1-2016 Saunois M, R B Jackson, P Bousquet, B Poulter, and J G Canadell (2016) The growing role of methane in anthropogenic climate change. Environmental Research Letters, vol. 11, 120207, DOI: 10.1088/1748-9326/11/12/120207. http://iopscience.iop.org/article/10.1088/1748-9326/11/12/120207 • Dalsoren et al. (2016): Atmospheric methane evolution the last 40 years, Atmos. Chem. Phys., 16,3099-3126, http://dx.doi.org/10.5094 acp-16-3099-2016 • Etiope G. (2015): Natural gas seepage. The earth’s Hydrocarbon Degassing, Springer International Publishing, 199 pp., 2015 • IPCC (2013) WGI. 5th Assessment Report. Intergovernmental Panel on Climate Change. Cambridge University Press, Cambridge, United Kingdom and New York, NY, USA. • Kirschke, S. et al. (2013): Three decades of global methane sources and sinks. Nature Climate Change, 6, 813-823,http://dx.doi.org/10.1038ngeo1955 • Meinshausen, M. et al. (2011): The RCP Greenhouse Gas Concentrations and their Extension from 1765 to 2300." Climatic Change (Special • Issue), http://dx.doi.org/10.1007/s10584-011-0156-z • Poulter B et al 2016 Global wetland contribution to increasing atmospheric methane concentrations (2000–2012) , submitted • Voulgarakis A. et al. (2013): Analysis of present day and future OH and methane lifetime in the ACCMIP simulations, Atm. Chem. Phys., 13, 2563-2587, http://dx.doi.org/10.5194/acp-13-2563-2013