Download
1 / 28
280 likes | 405 Vues
One of the unique features of our home planet is the

E N D
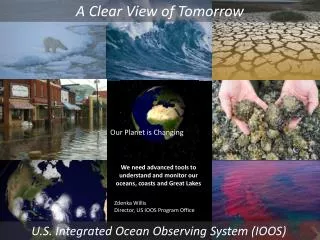
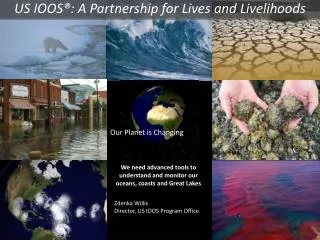
One of the unique features of our home planet is the water that covers approximately 71% of its surface. It is life-sustaining—nourishing every plant, animal, and human cell on Earth—and plays a major role in the complex processes of Earth’s climate. NASA’s Earth-observing satellites improve our understanding of our global water system. They monitor water-related processes such as sea-level change to help determine the effects on coastal areas and implications for global climate.
Satellites also track natural phenomena like El Niño to predict these events more accurately and reduce their harmful consequences. NASA satellites monitor ecosystems and provide important information for freshwater management. Earth science data increase our knowledge of the hydrologic cycle, a key factor in understanding climate and the interaction between the atmosphere, the ocean, and the land.
Scientists have used wind speed measurements to map out average wind intensity over the entire ocean for the period 2000–2007. Weather patterns, land-ocean interactions, land topography, and ocean temperatures, all influence wind speed, and are reflected in the maps shown here. Satellite measurements of ocean surface wind are provided in near real time to a number of international meteorological agencies for use in marine forecasting, operational weather prediction, and climate forecasting. Areas of high wind-power density, where winds are strongest, are shown here in purple, while low-power density regions are light blue and white. Note the red box in the December–February map highlighting Central America. June–August December–February Wind Power Density (Watts/m2) 0 250 500 1000 2000
December 9, 2003 During the winter in Central America, gale-force winds from the Gulf of Mexico are funneled through Chivela Pass, a narrow break in the Cordillera Mountains of Mexico. Gusting to speeds normally found only in major hurricanes, the Tehuano winds mix the normally warm surface waters with colder, nutrient-rich water that lies deep in the Gulf of Tehuantepec on southern Mexico’s Pacific coast. Here, blooms of algae (called phytoplankton) appear in the path of these winds, fueled by the banquet of nutrients. The satellite image at right shows the effect of the Tehuano winds on the ocean’s plant life on December 9, 2003. Rainbow colors indicate the intensity of the algal bloom by the amount of chlorophyll in the surface water. Land, ocean, and clouds are shown in “true color”. Gulf of Mexico Mexico Belize Guatemala Honduras El Salvador Nicaragua Gulf of Tehuantepec Costa Rica Pacific Ocean Chlorophyll-a Concentration (mg/m3) 0.04 1.0 20
February 10, 2006 The image at left shows sea surface temperatures off the Pacific coast of Central America on February 10, 2006. (See also the red box in the December–February image in the story in Slide #4 for this region’s location.) Again, the Tehuano winds pushed surface water away from shore allowing the colder, deep water to well up (in purple). Gulf of Mexico Mexico Belize Guatemala Gulf of Tehuantepec Honduras El Salvador Nicaragua Costa Rica Pacific Ocean
Mexico Mexico Guatemala Guatemala Gulf of Tehuantepec Gulf of Tehuantepec Sea Surface Temperature (°C) Ocean Chlorophyll Concentration (mg/m3) 20 25 30 32 0.04 0.4 4 40 The two maps above show a close-up of the Gulf of Tehuantepec. The right-hand map shows chlorophyll concentration, indicating where phytoplankton are more abundant. Note the highest concentration of chlorophyll shown in the map on the right closely corresponds to the cold waters indicated in the map on the left.
March February April January May December June November July October August September These images show seasonal variations in terrestrial water storage in the Amazon River basin during 2007. The distinct rainy and dry seasons are clearly visible in these maps. The amount of water present in the basin can be monitored from space by measuring changes in Earth’s gravity field. More water in the basin produces a stronger gravitational pull. Reds indicate areas where there is more water (stronger gravity field); blues indicate areas where there is less water (weaker gravity field).
La Niña: February 4, 2008 Calm Pacific Ocean: May 21, 2006 Mild El Niño: November 20, 2006 Sea Surface Height (millimeters) -180 -100 -60 0 60 100 180 A higher-than-normal sea surface is usually a sign of warm waters below, while low sea levels often indicate cooler-than-normal temperatures. During an El Niño event, changing ocean currents and atmospheric conditions bring warm waters from the western Pacific to the east along the equator. Conversely, La Niña events bring warmer waters to the west and cooler waters to the east. Both events alter weather patterns across the planet. The globe on the left shows the Pacific during near-normal conditions. Green indicates relatively calm conditions across the equatorial Pacific. In the center image, the yellow and red areas designate the warmer waters of a mild El Niño. In the right-hand image, the colder waters of La Niña are seen in blues and purples.
Water is vital to life on Earth. It is the only known substance that naturally exists in gas, liquid, and solid form within the relatively small range of air temperatures and pressures found at Earth’s surface. Because of this, water has profound consequences for Earth’s climate and ecosystems. It also has the capacity to store large amounts of heat and transport this heat over vast distances via ocean currents.
Water has other unusual chemical and physical properties that play important roles in shaping Earth’s environment. Ice, water’s solid phase, is less dense than liquid water and so it floats, insulating the water underneath. This prevents the complete freezing of bodies of water, whether a small pond or the Arctic Ocean. The insulating effect of ice enables the water below to sustain life through the harshest of winters. Water is also responsible for the transport of key nutrients vital to the survival of plant and animal life both on land and in the oceans.
Earth’s water cycle describes the movement of water molecules within the Earth-atmosphere system. Liquid water evaporates from the ocean, lakes, rivers, streams, and the land surface and rises into the atmosphere as water vapor that can condense to form clouds. Some of these clouds eventually produce raindrops or ice crystals large enough to fall back to Earth as precipitation, continuing the cycle. This whole process is powered by energy from the Sun and is a continuous exchange of moisture between the ocean, the atmosphere, and the land. Studies indicate that the ocean, seas, and land-based bodies of water (lakes, rivers, streams) provide nearly 90% of the moisture in our atmosphere. Plants release the remaining 10% of the moisture found in the atmosphere as they “breathe” through the process of transpiration. In addition, a very small portion of water vapor enters the atmosphere through sublimation, the process by which water changes directly from a solid (ice or snow) to a gas. (The gradual shrinking of snow banks, even though the temperature remains below the freezing point, results from sublimation.)
For clouds to form, two key ingredients are necessary: first, there must be moisture present, and, second, there must be tiny atmospheric particles—called aerosols—around which the water vapor can condense to form clouds and precipitation. Traffic and industrial activity are known to increase the amount of aerosols in our atmosphere, and scientists believe that this increased particulate pollution might help enhance rainfall in certain regions and even decrease it in others. They have found a possible link between rainfall and the day of the week that could be attributed to the increased levels of aerosol pollution from human activities. The torrential rainfall event depicted at right occurred in the Southeast U.S. during May 4-9, 2003 and appears to have exhibited this pattern. Note that the highest level of rainfall (red) is centered on two heavily populated areas in Tennessee: Nashville and Knoxville. Scientists studied rainfall averages from 1998 to 2005 and found that on average, satellite data indicated higher rain activity between Tuesday and Thursday than from Saturday through Monday in this area. More recent data from summer 2007 reflected this same midweek trend, with highest rainfall occurring late on Thursdays. Midweek increases in rainfall were significantly higher in the afternoon, when the conditions for summertime storms are ideal. In this case, data analysis revealed that afternoon rainfall peaked on Tuesdays, with 1.8 times more rainfall than on Saturdays. Saturdays experienced the least amount of afternoon rain of the whole week. So, while the typical weather conditions in the Southeast U.S. during summer are conducive to the formation of large storms anyway, there does appear to be an increase when the meteorological conditions are coupled with enhanced aerosol pollution. Aerosol pollution peaks midweek from the weekly pattern of human activities. Satellite radar observations indicate that when pollution is amplified, warm summer updrafts can carry the aerosol particles higher into the atmosphere, resulting in the formation of more intense storms with higher cloud tops. These storms are capable of producing significantly more rainfall. Ohio Indiana Illinois West Virginia Missouri Kentucky Virginia Nashville Knoxville North Carolina Tennessee Arkansas South Carolina Mississippi Georgia Alabama Louisiana Atlantic Ocean Average Rain Rate (mm/hr) 100 200 300 400
The graph above shows that globally averaged sea level rose by about four and a half centimeters (1.8 inches) between 1993 and 2006. Rising sea levels are a very important consequence of global warming because of flooding along coastal regions. The oceans bear the brunt of global warming, absorbing a large part of the extra heat trapped by human-generated greenhouse gases. As they warm, ocean waters expand causing sea levels to rise. Sea level also rises when water is added to the ocean. This occurs as glaciers and ice sheets begin to melt more quickly than they are rebuilt by accumulating snow. Both of these signals are contained in the record of sea-level rise. About one third of the rise in global sea level since 1993 can be attributed to thermal expansion of the ocean, with the rest caused by melting ice. As Earth warms, these proportions are likely to change, sometimes with dramatic consequences. For example, in the past decade, glaciers in Greenland have been accelerating their flow toward the ocean in response to climate warming. The loss of ice doubled between 1996 and 2005.
Cape Canaveral Predicting future rates of sea level rise caused by global warming is one of the biggest challenges faced by climate scientists today. In the long run, thermal expansion from ocean warming may raise sea level by as much as half a meter in 100 years. The ice sheets of Greenland and West Antarctica, however, contain enough ice to raise sea level by 70 meters (230 feet). How fast will they melt? It’s difficult to say, but a few meters of sea level rise over the next century is certainly possible. A rise as high as two meters would have a major impact on coastal cities, as shown in the map of Florida at left. Dark gray indicates those areas that would be inundated by higher sea levels. West Palm Beach Florida Tampa Ft. Myers Everglades National Park Florida Keys
Trade winds are the prevailing winds that blow in Earth’s equatorial regions. These gentle tropical breezes, particularly those that blow in the equatorial Pacific, can have a far-reaching effect on life around the world. As the Pacific trade winds wax and wane they change the temperature distribution of the ocean, triggering changes in weather patterns all around the world. The waters of the western Pacific Ocean are typically about 8°C (14°F) warmer than those in the eastern Pacific. Consequently, sea levels near Indonesia are usually about half a meter higher than those near South America. Under “normal” conditions (top right diagram), trade winds blow from east to west across the Pacific and push warm surface waters westward. This causes the upwelling of deep, colder waters to the surface off the coast of South America. But every few years, for reasons that aren’t entirely understood, the pattern changes. The altered patterns have been named El Niño and La Niña, the Spanish terms for “the boy child” and “the girl child”, respectively.
Normal Conditions La Niña Conditions El Niño Conditions During La Niña conditions (center), the trade winds are unusually strong. The normal upwelling (left) of colder waters near South America is enhanced along the equator, and this contributes to colder-than-normal surface waters along the equatorial Pacific. Conversely, during El Niño conditions (right), the trade winds weaken, thus halting the normal upwelling of cold water. The consequential warming of the ocean surface further weakens the trade winds and strengthens El Niño.
Sea Surface Temperature Difference (°C) -5 0 5 The map above shows sea temperatures in the topmost millimeter of water during a La Niña event in November 2007. The dark band denotes the extent of the cold water along the equator, with the coldest near South America. During this La Niña event, satellites detected lower-than-normal sea levels along the equatorial Pacific, commensurate with cooler waters.
La Niña Conditions El Niño Conditions During a La Niña the northwest U.S. often experiences cooler, wetter weather and the southeastern states have unusually low rainfall. Above-average rainfall can persist in the western Pacific and the Indian Ocean. Atlantic tropical storms and hurricanes are often more numerous. In El Niño years, the rains that normally occur in Indonesia and Australia tend to move eastward leaving drier-than-average conditions in these areas. In more temperate latitudes, winters tend to be milder, as over the northern U.S. and western Canada. The southern U.S. states from Texas to Florida generally experience increased rainfall. Relocated jet streams contribute to a decrease in tropical hurricane activity in the Atlantic basins. Scientists are striving to accurately forecast El Niño and La Niña further in advance to help economic and agricultural policy makers plan for the short-term climate fluctuations associated with these phenomena. Satellite observations continue to play a crucial role in ensuring the success of these forecasts by providing accurate measurements of the present conditions in the region, an essential first task for prediction.
Phytoplankton are microscopic plants that live in the ocean. They contain chlorophyll and depend upon sunlight to grow, just like land plants do. Phytoplankton are most abundant at the ocean’s surface. These tiny marine plants play a crucial role in the carbon cycle by helping to remove carbon dioxide from the atmosphere. Collectively, they comprise the base of the marine food chain, feeding life in the ocean around the world. Chlorophyll gives phytoplankton their greenish color and scientists have developed techniques to track worldwide patterns of chlorophyll (and other pigments) from space. They have been making satellite-based observations of ocean color for over 20 years. Ocean water containing high concentrations of phytoplankton will appear blue-green to green, depending upon the type and density of the phytoplankton population there.
Since phytoplankton are sensitive to changes in water quality, sunlight, and nutrients over time, they are a good indicator of environmental change. Scientists have found, for instance, a correlation between changes in sea surface temperature (SST), ocean nutrients, and phytoplankton growth. When SSTs warm up, as during El Niño, ocean nutrients tend to remain in the cooler depths. Less mixing of nutrients with warmer surface waters reduces phytoplankton populations. As populations decrease, fish and mammals depending on phytoplankton for food starve. When SSTs cool, upwelling of cold water brings nutrients from deeper waters. Cool, nutrient-rich waters during La Niña experience an increase in normal phytoplankton growth.
Chlorophyll-a Concentration (mg/m3) <0.01 0.3 5 50 El Niño, January 1998 The two maps at right illustrate the effects of SST on phytoplankton growth during an especially dramatic El Niño-La Niña event in the late 1990s. The top panel shows the equatorial Pacific in its warm, nutrient-depleted phase of an El Niño. Surface waters show little sign of phytoplankton chlorophyll present. The bottom panel shows the nutrient-rich phase of a La Niña, with the dark band around the equator indicating a high concentration of chlorophyll. Some oceanographers are concerned that rising ocean temperatures will slow phytoplankton growth, harming marine ecosystems and causing carbon dioxide to accumulate more rapidly in the atmosphere. Changes in phytoplankton levels influence fishery yields and the amount of carbon dioxide that the oceans can remove from the atmosphere. These changes can have major impacts on the future of our ocean’s food web and implications for Earth’s climate. Mexico Pacific Ocean S. Am. Australia La Niña, June 1998 Mexico Pacific Ocean S. Am. Australia
Aqua The Aqua mission, launched in 2002, carries six instruments, two of which provide significant contributions to water studies. These are the Moderate Resolution Imaging Spectroradiometer (MODIS) and the Advanced Microwave Scanning Radiometer for the Earth Observing System (AMSR-E). MODIS provides a comprehensive series of global observations every two days at spatial resolutions up to 250 meters (820 feet). MODIS measures the type and extent of ocean chlorophyll, pigment concentration, sea surface temperature, and water-leaving radiance. These measurements are used to study ocean currents, upwelling, and air-sea interaction. AMSR-E monitors water vapor profiles, precipitation, water vapor distribution, cloud water, sea surface temperature, and a variety of other climate variables. The microwave measurements allow surface observations under dark as well as sunlit conditions and under both cloud-covered and cloud-free conditions. It provides an all-weather capability for surface observations that is not available with visible and infrared imagery. The instrument was contributed to the EOS program by the National Space Development Agency (NASDA) of Japan, now merged into the Japan Aerospace Exploration Agency (JAXA).
OrbView-2 The Sea-viewing Wide Field-of-View Sensor (SeaWiFS) aboard ORBIMAGE’s (Orbital Imaging Corporation) OrbView-2 satellite provides data to study subtle changes in ocean color. These color differences signify various types and quantities of marine phytoplankton (microscopic marine plants). Mapping out phytoplankton distributions and populations has both scientific and practical applications. NASA purchases SeaWiFS data for research and educational purposes. TRMM The Tropical Rainfall Measuring Mission (TRMM) is the first mission dedicated to quantifying tropical and subtropical rainfall through microwave and visible infrared sensors. TRMM is a joint project between the U.S. and Japan and has the first spaceborne rain radar. Tropical rainfall comprises more than two thirds of global rainfall and is the primary driver of global atmospheric circulation as a heat source. The Global Precipitation Measurement (GPM) mission will take over for TRMM at a future date, providing more accurate, more frequent, and more detailed global precipitation measurements.
GRACE The Gravity Recovery and Climate Experiment (GRACE) is a joint U.S./German Earth-orbiting mission launched from Plesetsk Cosmodrome in Russia on March 17, 2002. The mission’s two spacecraft fly in tandem to precisely measure Earth’s gravity field. They enable a better understanding of ocean surface currents, ocean heat transport, Earth’s two remaining ice sheets, and other aspects of hydrology, oceanography, and solid-Earth sciences. Ocean currents transport mass and heat between different regions of the planet. Jason-1 and OSTM/Jason-2 The instruments aboard Jason-1 map ocean surface topography to provide information on ocean wave heights, sea surface topography, tides, and water vapor. Data collected by these instruments advance our understanding of ocean circulation and improve our ability to forecast climate events and measure global sea-level change.The Ocean Surface Topography Mission on the Jason-2 satellite (OSTM/Jason-2) continues the tasks of the Jason-1 mission. It was launched in June 2008 from Vandenberg Air Force Base in California.
QuikScat Launched in June 1999, NASA’s Quick Scatterometer (QuikScat) acquires accurate, high-resolution, near-surface wind speed and direction under clear and cloudy conditions, night and day, over Earth’s oceans. These measurements are the major components of air-sea interaction. They help us to characterize, understand, and predict environmental, weather, and climate changes.
Aquarius The Aquarius satellite will focus on taking global measurements of ocean salinity. These measurements will increase our understanding of the relationship between ocean circulation and the processes that relate salinity variations to climatic changes in the global cycling of water. It is expected to launch in 2010. SMAP The Soil Moisture Active-Passive (SMAP) mission will provide global observations of surface soil moisture and freeze/thaw state to improve our understanding of the relationships between water, energy, and carbon cycles. It is planned for launch in 2013.