Download
1 / 20
210 likes | 224 Vues
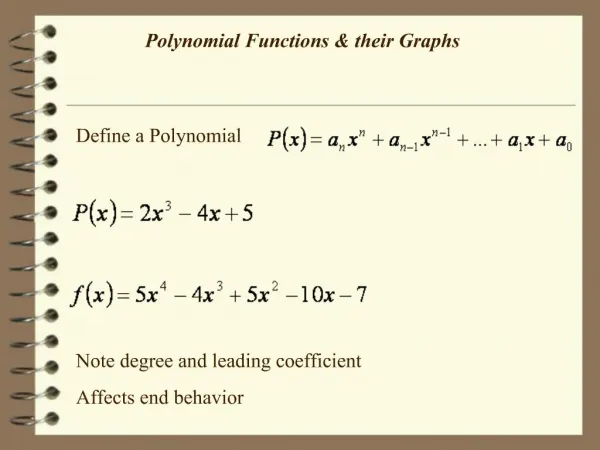
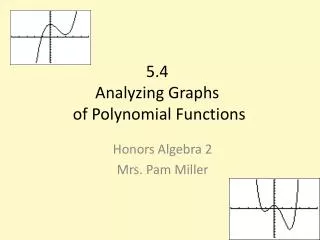
Investigating Graphs of Polynomial Functions. Section 6-7. Graphs of Polynomial Functions. Graphs of Polynomial functions: Are Continuous – No Breaks Have smooth turns With degrees of n , have at most n-1 turns. In other words, if the polynomial has a degree of 3, there will be 2 turns.

E N D
Investigating Graphs of Polynomial Functions Section 6-7 6-7 - Investigating Graphs of Polynomial Functions
Graphs of Polynomial Functions Graphs of Polynomial functions: • Are Continuous – No Breaks • Have smooth turns • With degrees of n, have at most n-1 turns. • In other words, if the polynomial has a degree of 3, there will be 2 turns. • If the polynomial has a degree of 4, there will be 3 turns, etc… 6-7 - Investigating Graphs of Polynomial Functions
Turns • If the first coefficient is POSITIVE, it will RISE to the right (positive x side). • If the first coefficient is NEGATIVE, it will FALL to the right. • If the top degree is an EVEN number, the graph will RISE to the left (negative x side). • If the top degree is an ODD number, the graph will FALL to the left. • Exception to the rule, if the degree has a negative coefficient, its OPPOSITE. >> FOLLOW THE ARROWS << 6-7 - Investigating Graphs of Polynomial Functions
Polynomials How many turns are there? Linear: 0 turns Quadratic: 1 turn 6-7 - Investigating Graphs of Polynomial Functions
Polynomials 2 turns 3 turns 4 turns 6-7 - Investigating Graphs of Polynomial Functions
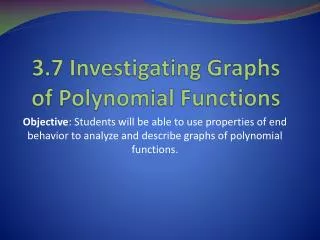
Determining End Behavior • Degree • Sign of Leading Coefficient • Touchdown- • Offsides- • Disco 1- • Disco 2-
End behavior is a description of the values of the function as x approaches infinity (x +∞) or negative infinity (x –∞). The degree and leading coefficient of a polynomial function determine its end behavior. It is helpful when you are graphing a polynomial function to know about the end behavior of the function. End Behavior As x goes to negative infinity, P(x) goes to negative infinity 6-7 - Investigating Graphs of Polynomial Functions
Example 1 How many turns? How would you describe the graph from negative x? 2 6-7 - Investigating Graphs of Polynomial Functions
Example 2 How many turns? How would you describe the graph from positive x? 2 6-7 - Investigating Graphs of Polynomial Functions
Example 3 How many turns? How would you describe the graph from negative x to positive x? 4 6-7 - Investigating Graphs of Polynomial Functions
Example 4 How many turns? How would you describe the graph from negative x to positive x? 3 6-7 - Investigating Graphs of Polynomial Functions
Example 5 Identify the end behavior of P(x) = 2x5+ 3x2 – 4x –1 As x –∞, P(x)–∞. As x +∞, P(x) +∞. 6-7 - Investigating Graphs of Polynomial Functions
Example 6 Identify the end behavior of P(x) = 2x5+ 6x4 – x + 4 As x –∞, P(x)–∞. As x +∞, P(x) +∞. 6-7 - Investigating Graphs of Polynomial Functions
Example 7 Identify the end behavior of P(x) = 2x5+ 6x4 – x + 4 As x –∞, P(x)–∞. As x +∞, P(x) –∞. 6-7 - Investigating Graphs of Polynomial Functions
Graphing Polynomials • Plug the equation into the graphing calculator, Y= • Look at the table to plot points • Sketch the graph • Describe the end behaviors As x –∞, P(x)–∞. As x +∞, P(x) –∞. 6-7 - Investigating Graphs of Polynomial Functions
Example 8 Graph the function. f(x) = x3 + 4x2 + x – 6. As x –∞, P(x)–∞. As x +∞, P(x) +∞. 6-7 - Investigating Graphs of Polynomial Functions
Assignment Page 457 15-22,32-35,36-41 my.hrw.com mstarkey42 panthermath 6-7 - Investigating Graphs of Polynomial Functions