Download

1 / 31
370 likes | 938 Vues
Chapter 3 Market Demand and Supply. demand direct demand utility derived demand demand function demand curve change in the quantity demanded shift in demand Supply. supply function supply curve change in the quantity supplied shift in supply equilibrium market equilibrium price

E N D
demand direct demand utility derived demand demand function demand curve change in the quantity demanded shift in demand Supply supply function supply curve change in the quantity supplied shift in supply equilibrium market equilibrium price surplus shortage comparative statics analysis KEY CONCEPTS
OVERVIEW • Basis for Demand • Market Demand Function • Demand Curve • Basis For Supply • Market Supply Function • Supply Curve Market Equilibrium
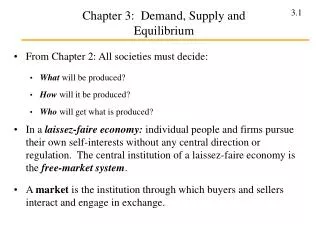
一. Basis for Demand • 1.Direct Demand versus derived demand • Demand is the quantity customers are willing to buy under current market conditions. • Direct demand is demand for consumption.
**Derived Demand • Derived demand is input demand. • Firms demand inputs that can be profitably employed.
2. Market Demand Function • 1.Determinants of Demand • Demand is determined by price, prices of other goods, income, and so on. • 2.Industry Demand Versus Firm Demand • Industry demand is subject to general economic conditions. • Firm demand is determined by economic conditions and competition.
3.Demand Curve • Demand Curve Determination • The price-quantity demanded relation. • All non-price variables are held constant.
4.Relation Between the Demand Curve and Demand Function • Move along demand curve when price changes. • Shift to another demand curve when non-price variables change.
A summary of what can cause an increase in demand a. Favorable change in consumer tastes. b. Increase in the number of buyers. c. Rising income if product is a normal good. d. Falling incomes if product is an inferior good. e. Increase in the price of a substitute good. f. Decrease in the price of a complementary good. g. Consumers expect higher prices in the future.
二.Basis For Supply • 1.How Output Prices Affect Supply • Firms offer supply to make profits. • Higher prices boost the quantity supplied. • Lower prices cut the quantity supplied. • 2.Other Factors That Influence Supply • Everything that affects marginal production costs affects supply. • If MC falls, supply rises. • If MC rises, supply falls.
2.Market Supply Function • Determinants of Supply • Supply is determined by price, prices of other goods, technology, and so on.
The determinates of supply = supply shifters 1.Resource prices 2.Price of related goods 3. Technology 4.Number of sellers 5.Taxes and subsidies 6.Expected future prices 7.Nature, ‘random shocks’ and other unpredictable events
Industry Supply Versus Firm Supply • Firm supply is determined by economic conditions and competition. • Industry supply is the horizontal sum of firm supply.
3.Supply Curve • Supply Curve Determination • The price-quantity supplied relation. • All non-price variables are held constant.
4.Relation Between Supply Curve and Supply Function • Move along supply curve when price changes. • Shift to another curve when non-price variables change.
What effect will each of the following have on the supply of product B? a. A technological advance in the methods of producing B. b. A decline in the number of firms in industry B. c. An increase in the price of resources required in the production of B. d. The expectation that the equilibrium price of B will be lower in the future than it is currently. e. A decline in the price of product A, a good whose production requires substantially the same techniques as does the production of B. f. The levying of a specific sales tax upon B. g. The granting of a 50-cent per unit subsidy for each unit of B produced.
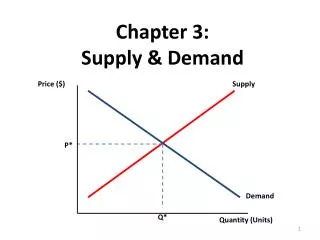
三.Market Equilibrium • 1. Surplus and Shortage • Surplus is excess supply. • Shortage is excess demand.
2.Comparative Statics: Changing Demand • Equilibrium changes with demand shifts. • Comparative Statics: Changing Supply • Equilibrium changes with supply shifts. • Comparative Statics: Changing Demand and Supply
Three steps for analyzing changes in equilibrium • 1. To decide whether the event shifts supply or demand curve (or perhaps both). • 2. To decide in which direction the curve shifts. • 3. To use the supply- demand diagram to see how the shift changes the equilibrium price and quantity.
The effects of the following changes have on Pe and Qe: • A. Supply decreases and demand is constant. • B. Demand decreases and supply is constant. • C. Demand increases and supply increases. • D. Supply increases and demand decreases. • E. Demand decreases and supply decreases. • F. Supply decreases and demand increases
“Prices are the automatic regulator that tends to keep production and consumption in line with each other.” Explain.
Advanced analysis: Assume that the demand for a commodity is represented by the equation P = 10 ‑ .2Qd and supply by the equation P = 2 + .2Qs, where Qd and Qs are quantity demanded and quantity supplied, respectively, and P is price. Using the equilibrium condition Qs = Qd, solve the equations to determine equilibrium price. Now determine equilibrium quantity. Graph the two equations to substantiate your answers.
Discuss the economic aspects of ticket scalping, specifying the gainers and losers