Download
1 / 13
170 likes | 389 Vues
What is Statistics. Chapter 1. GOALS. Understand why we study statistics. Explain what is meant by descriptive statistics and inferential statistics. Understand the difference between a population and a sample; why we do sampling.

E N D
What is Statistics Chapter 1
GOALS • Understand why we study statistics. • Explain what is meant by descriptive statistics and inferential statistics. • Understand the difference between a population and a sample; why we do sampling. • Distinguish between a qualitative variable and a quantitative variable. • Describe how a discrete variable is different from a continuous variable. • Distinguish among the nominal, ordinal, interval, and ratio levels of measurement.
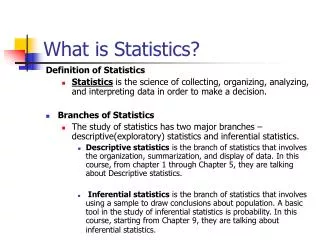
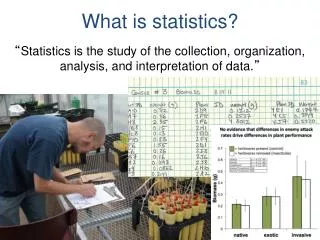
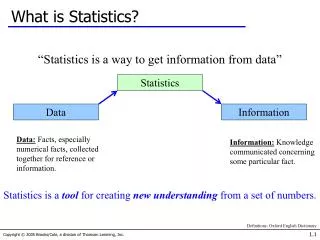
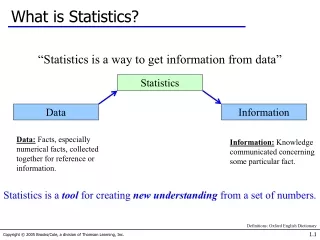
What is Meant by Statistics? Statisticsis the science of collecting, organizing, presenting, analyzing, and interpreting numerical data to assist in making more effective decisions.
Who Uses Statistics? Statistical techniques are used extensively by marketing, accounting, quality control, consumers, professional sports people, hospital administrators, educators, politicians, physicians, etc...
Types of Statistics – Descriptive Statistics Descriptive Statistics - methods of organizing, summarizing, and presenting data in an informative way. EXAMPLE 1: A Gallup poll found that 49% of the people in a survey knew the name of the first book of the Bible. The statistic 49 describes the number out of every 100 persons who knew the answer. EXAMPLE 2: According to Consumer Reports, General Electric washing machine owners reported 9 problems per 100 machines during 2001. The statistic 9 describes the number of problems out of every 100 machines. Inferential Statistics: A decision, estimate, prediction, or generalization about a population, based on a sample.
A populationis a collection of all possible individuals, objects, or measurements of interest. A sample is a portion, or part, of the population of interest Population versus Sample
Sampling from a Population • We select a sample and collect data from the sample members, because it is generally difficult or impossible to collect data on every member of a population. • We want our sample to be representative, i.e., to closely resemble the entire population. Example: We want to predict the outcome of the 2008 Presidential election. There are over 100,000,000 registered voters. Rather than poll every registered voter, we select a sample of approximately 1000 voters, and poll the members of the sample. If we want useful information, we must use a selection method that will give us a representative sample.
Types of Variables A.Qualitative or Attribute variable - the characteristic being studied is nonnumeric. EXAMPLES: Gender, religious affiliation, type of automobile owned, state of birth, eye color are examples. B.Quantitative variable - information is reported numerically. EXAMPLES: balance in your checking account, minutes remaining in class, or number of children in a family.
Quantitative Variables - Classifications Quantitative variables can be classified as either discrete or continuous. Data analysis techniques differ for different types of data. A. Discrete variables: can only assume certain values and there are usually “gaps” between values. EXAMPLE: the number of bedrooms in a house, or the number of hammers sold at the local Home Depot (1,2,3,…,etc). B. Continuous variable can assume any value within a specified range. EXAMPLE: The pressure in a tire, the weight of a pork chop, or the height of students in a class.
Nominal level - data that is classified into categories and cannot be arranged in any particular order. EXAMPLES: eye color, gender, religious affiliation. Ordinal level – involves data arranged in some order, but the differences between data values cannot be determined or are meaningless. EXAMPLE: During a taste test of 4 soft drinks, Mellow Yellow was ranked number 1, Sprite number 2, Seven-up number 3, and Orange Crush number 4. Interval level - similar to the ordinal level, with the additional property that meaningful amounts of differences between data values can be determined. There is no natural zero point. EXAMPLE: Temperature on the Fahrenheit scale. Ratio level - the interval level with an inherent zero starting point. Differences and ratios are meaningful for this level of measurement. EXAMPLES:Monthly income of surgeons, or distance traveled by manufacturer’s representatives per month. Four Levels of Measurement