Download
1 / 26
260 likes | 405 Vues
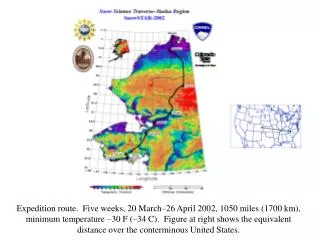
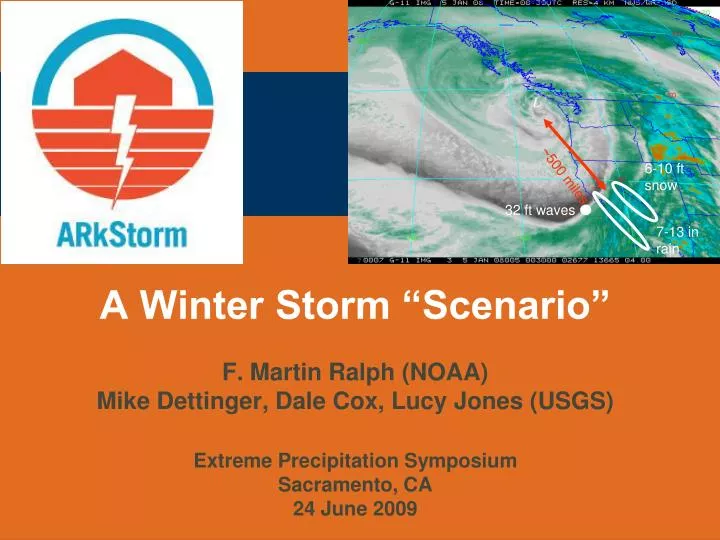
A Winter Storm “Scenario” F. Martin Ralph (NOAA) Mike Dettinger, Dale Cox, Lucy Jones (USGS) Extreme Precipitation Symposium Sacramento, CA 24 June 2009. 6-10 ft snow. ~500 miles. 32 ft waves. 7-13 in rain. L. Outline. What is a “Scenario?” The Earthquake “ShakeOut” Scenario

E N D
A Winter Storm “Scenario” F. Martin Ralph (NOAA)Mike Dettinger, Dale Cox, Lucy Jones (USGS)Extreme Precipitation SymposiumSacramento, CA24 June 2009 6-10 ft snow ~500 miles 32 ft waves 7-13 in rain L
Outline • What is a “Scenario?” • The Earthquake “ShakeOut” Scenario • Building A Winter Storm Scenario (WSS) • Scope (the 1861/82 precedent) • Establishing a Plausible WSS
Building an Earthquake Scenario POLICY SocialImpacts EconomicImpacts Social Sciences Emergencyresponse Casualties Engineering Lifelines Triggered hazards Structures Infra-structure Earth Science Secondary hazards Shaking The Fault 3
Mitigation Loop Earth Science: Design earthquake Policy:Actions that could reduce losses Social Science: Estimate impact on social systems Engineering: Estimate physical damage Mitigation
The Great Southern California ShakeOut • A week-long series of events to inspire southern Californians to improve their earthquake resiliency • Based on a scenario of a major southern San Andreas earthquake led by the USGS • Put on by the Earthquake Country Alliance, a coalition of earthquake professionals
ShakeOut Goals • Participation of at least 5 million people in the ShakeOut Drill • School, Business, and Community Organization recruitment effortswill have several million people participate • Everyone is encouraged to “spread the word” to promote peopleparticipating in the ShakeOut! • Shift the culture in southern California about earthquakes • We must all take greater responsibility for readiness • We all need to talk about earthquakes and preparedness more often • Significant increase in earthquake readiness at all levels
ShakeOut Goal: 5 million participants • As of 12/3/09 • Total: 5.47 million • Imperial: 44,407 • Kern: 107,734 • Los Angeles: 2.7 million • Orange: 896,669 • Riverside: 590,677 • San Bernardino: 501,677 • San Diego: 468,878 • Ventura: 83,472 • Other: 59,369
"This is the best single effort in emergency preparedness in my nearly 20 years in the business. The Golden Guardian / Great Shake Out project did more to prepare our cities than all previous efforts combined for many years past. I have never had so much participation and interest in disaster preparedness. And it continues! - Los Angeles County Emergency Manager
What next? • Need to keep the ball rolling • Evolve to annual event • Continue interaction with utilities and first responders • Many identified gaps • Data and techniques could be improved for future scenarios • Media, graphics, websites still in development • Technical Issues • Geographic Information System (GIS) - exchange of information • - COM - Common Operating Maps (Digital Maps throughout EOC’s) • - US National Grid (geospatial interoperability) • Scenarios for other disasters • Next comes winter storms!
Multi-Hazards Working Groups • Fire / Debris Flow • 2007 Post Fire Coordination • Earthquake / Tsunami • Earthquake Scenario • Winter Storm • Winter Storm Scenario • Information Interface • Community Interface, Implementation, Tools and Training
Building a Winter Storm Scenario POLICY Social Sciences SocialImpacts EconomicImpacts Forecasting Casualties Emergencyresponse Engineering Lifelines Flood Management Structures Infra-structure Earth Science Floods, Coastal Erosion, Landslides, Environmental The Storm
The “Atmospherics” Team • Mike Dettinger (Co-Lead; USGS-Scripps) • Marty Ralph (Co-Lead; NOAA Research/ESRL/PSD) • Dan Cayan (Scripps-USGS) • Dave Danielson (NOAA/NWS-Oxnard) • Gary Estes (American River Watershed Institute) • Rob Hartman (NOAA/NWS/CNRFC) • Mimi Hughes (NOAA Research/ESRL/PSD) • Mark Jackson (NOAA/NWS-Oxnard) • George Kiladis (NOAA Research/ESRL/PSD) • John Monteverdi (San Francisco State Univ.) • Paul Neiman (NOAA Research/ESRL/PSD) • Jan Null (Golden Gate Weather Services) • Kelly Redmond (Desert Research Inst.) • Dave Reynolds (NOAA/NWS-Monterey) • Maury Roos (DWR-Sacramento)
The 1861-1862 Floods • Dec 1861: Major flood in NorCal (including Sacramento) • Jan 1862: Major flood in NorCal (including Sacramento) • Jan 1982: Major flood in SoCal (including Los Angeles and Orange County) • 12 days separated the flood crest in Sacramento from the crest in Los Angeles in Jan 1862 • Implication: A combined NorCal+SoCal extreme event is plausible* • *Emergency managers advised WSS to cover both SoCal & NorCal • In key respects, the1862 flooding is an historical analogue to the 1906 earthquake.
The Methodology - I • The Storm Team met in February 2009 and developed a basic methodology to create a plausible storm • Two relatively recent extreme storms were selected, one focused on SoCal (Jan 1969), and another on NorCal (Feb 1986). • The synoptic weather patterns were examined and the two events were “stitched” together to form one extended storm period lasting roughly 3 weeks. • Both were well-defined atmospheric river (AR) cases. • The SoCal event was augmented by assuming the AR could plausibly have stalled for one extra day. • The NorCal event was augmented by the fact that the Jan 1969 event also produced heavy rain in NorCal, thus preconditioning the region for greater impacts.
The Methodology - II • Because the WSS atmospherics team must deliver precipitation, wind, and temperature to the water, coastal and debris flow WSS teams, a modeling approach was selected as the preferred method of generating the scenario. • The Weather Research and Forecast (WRF) numerical weather prediction model was used. • Initial and boundary conditions were provided by the NCEP-NCAR Global Reanalysis. • To achieve the desired inputs for runoff and other models, the WRF model simulation system included downscaling to a 6 km grid over most of CA, and down to 2 km is selected areas. • The simulations are in progress, and results are encouraging.
Southern storm analogue: 19-26 Jan 1969 NCEP-NCAR Global Reanalysis Mean Anom 500-mb Z (m) 925-mb Z (m) IWV (mm) IVT (kg/s/m)
Southern storm analogue: 12-20 Feb 1986 NCEP-NCAR Global Reanalysis Mean Anom 500-mb Z (m) 925-mb Z (m) IWV (mm) IVT (kg/s/m)
Transitions from the January 1969 storm to the February 1986 and December 1996 storms: NCEP-NCAR Global Reanalysis daily mean fields of 500 mb geopotential heights (m) Day-4: 08-Feb-86 Evaluation of synoptic weather patterns identified the best fit was between 27 Jan 1969 and 8 Feb 1986 Thus, roughly a week separates the two major storms in the WSS. Day-4: 22-Dec-96 Day+1: 27-Jan-69 Day+0: 26-Dec-96
The Precipitation Fields • The following slides illustrate the approximate distribution of precipitation during the WSS. • Jan 1969 precipitation from Prism • Jan 1969 precipitation from Prism with 25 Jan doubled • Feb 1986 precipitation from PRISM • Total precipitation in the WSS time period
The WSS Atmospherics Team is developing a weather scenario that is based on historical events combined and amplified using physically based methods, built partly on the 1861- 1862 historical events, but applying modern knowledge, tools and methods to create a plausible series of extreme storms modeled after two major past events in 1969 and 1986.