Download
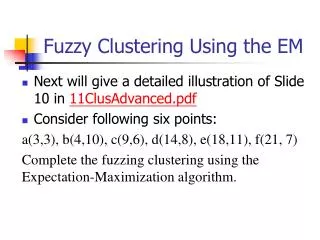
1 / 39
390 likes | 559 Vues
Examining Activity Patterns Using Fuzzy Clustering. by D De Silva, University of Calgary JD Hunt, University of Calgary PROCESSUS Second International Colloquium Toronto ON, Canada June 2005. Overview. Introduction Data Method Preliminary Results Conclusions. Introduction. Context

E N D
Examining Activity Patterns Using Fuzzy Clustering by D De Silva, University of Calgary JD Hunt, University of Calgary PROCESSUS Second International Colloquium Toronto ON, Canada June 2005
Overview • Introduction • Data • Method • Preliminary Results • Conclusions
Introduction • Context • Activity-based transport models increasing • Need for grouping into segments • At present seems largely based on received wisdom • Motivations • Opportunity in Calgary • Large Household Activity Diary Survey • Interest in Activity-based model development • Willingness to explore issue of grouping • Increase understanding of activity patterns resulting from behavioral processes
Introduction • Previous work • Fair amount of work drawing in essence on three basic elements • Data interpretation • Similarity or Dissimilarity Measures • Pattern Recognition Algorithms
Introduction • Previous work (Contd.) • Data Interpretation • Some used Time Slices in 5 to 15 minute intervals (Recker et al; Wilson) • Others Disagreed with it and used number of stops made. (Pas) • Similarity or Dissimilarity Measures • Similarity Matrix (Pas;Wilson; Ma) • Sequential Alignment Method (Wilson; Jun Ma) • Walsh-Hadamand transformation, a Fourier Type Analysis, (Recker et al) • Pattern Recognition Algorithms • All have used Crisp Clustering Methods
Introduction • Previous work (Contd.) • Groups with similar activities • Pas – 12 groups based on the number of non-home stops • Recker – 7 Groups based on Socio Economic Data • Wilson – 8 groups Similar to Recker • Applications • To Model Inter Shopping Duration (Bhat) • Micro simulation of Activity Patterns (Kitamura et al; Kulkarni et al) • Extension – the work described here • Time Slices • Sequential Alignment Method • Fuzzy Clustering
DataHousehold Activity Survey (HAS) • 24-hour diary • Fall of 2001 • Sample size • 8,400 households overall • 5,900 on weekdays • 15-minute intervals • activity • location • Activities in 19 categories • Locations • X,Y • Home, Work , Travel, Other • All household members
Activities Covered in HAS • Travel (A) • Pick Up Someone (B) • Drop Off Someone (C) • Work (D) • School / Homework (E) • Shopping (F) • Daycare (G) • Social (H) • Eating (J) • Entertainment / Leisure (K) • Medical / Financial (L) • Exercise (M) • Religious / Civic (N) • Sleeping (O) • Household Chores (P) • Park / Un-park Vehicle (X) • Work-Travel(e.g. Taxi Driver) (Y) • Out-of-Town (Z)
Example Sequence • Activity Sequence of • 30 min Sleep • 15 min Eat • 30 min Travel • 1 hr Work • O O J A A D D D D
Initial Sample for Testing • Covered in this presentation • 75 persons • 50 households • Just activity type and weekdays (not location & weekends) • Later consider: • Full sample • Weekends and weekdays • Location types as a further dimension
Data Set (Time Slices) Fuzzy Cluster Memberships Dissimilarity Matrix Fuzzy Clustering (S-Plus Software) Sequential Alignment Method (CLUSTALG Software) • Cluster Center Interpretation • Socio Economic Variable Distribution • Fuzzy Weighted Frequency Distributions Groups of Similar Activity Patterns Method
Sequential Alignment Method (SAM) • Alignment Methods first used in field of Molecular Biology for DNA matching • Activity Travel Patterns Intrinsically Sequential • SAM Evaluation of Sequence of Characters • Global Alignment (Whole Sequence) • Local Alignment (Short sequence within entire sequence) • Simplest case is Pairwise alignment
Sequential Alignment Method • Pairwise Alignment • Two Character Sequences • ID 1: O O J A A D D D D • ID 2: O O O J A D D D O • Elementary Operations until equal • Insertions and Deletions (Indel) • Gaps • Gap insertion and extension Penalties • Global Alignment – Needleman & Wunch algorithm minimizing the distance or maximizing the similarity • ID 1: - O O J A A D D D D - • ID 2: O O O J A - D D D – O • Similarity Score = 70 • Lesser operations Similar Pair
Sequential Alignment Method • Gap Opening and Extension Penalties • Role of gap penalty • High Value • Alignment compressed • Literally to matches avoiding gaping • Resemble main activities at their relative times • Recommended values 8 and 3 (Wilson) • Low Value • Identification of similar activities displaced during the day • Better pairwise comparison • Little similarity to the actual activity Pattern • Recommended values 1 and 0.1 (Wilson) • Tested and accepted recommendation of Low Value for Transportation Research (Wilson)
Sequential Alignment Method • Multiple Alignment • Extension of pairwise alignment to N dimensions • Computation power enormous after 10 sequences of reasonable length • Approximation method based on data of pairwise alignment • Use of ClustalG software by Wilson
Sequential Alignment Method • Output is a Dissimilarity Matrix
Fuzzy Clustering • Partition Clustering Method • Number of clusters k - specified in front • The Objects (Activity Patterns) are not assigned to a particular cluster but assigned a membership ranging between 0 and 1 for all clusters • Uses S-plus Software (Kaufman Procedure) • Dissimilarity matrix is input
Fuzzy Clustering • Minimize Objective Function (Kaufman)
Fuzzy Clustering • Number of clusters ? • An Open question – To be determined as part of research • Two quality indices from S-Plus • Dunn’s Coefficient • Average Silhouette Value with Shadow plot
Fuzzy Clustering • Dunn’s Coefficient Where Fk always lies in the range [1/k,1]. • entirely Fuzzy Clustering • Crisp Clustering
Average Silhouette Value (ASV) with Shadow plot Strength of Classification to the nearest crisp cluster compared to the next best cluster Width of Bar 1 – Well Classified 0 – Between two clusters 0< - Badly classified (lies near the next best cluster) Average Value gives a approximation to the best number of clusters ASV must be higher than 0.25 Fuzzy Clustering
Cluster Center Interpretation • Distributions of socio-economic variables • Basis for grouping in subsequent modeling • Person characteristics: • Age • Gender • Person type category from survey • Employment Status • Household characteristics: attributed to persons • Only income so far • Household structure later • Fuzzy weighted frequency distributions • Need for eventual Crisp • Potentially use logit to assign cluster membership values • Calibrate ‘utility functions’ for clusters with person characteristics • Use Monte Carlo to select specific cluster in each case
Cluster Center Interpretation • Fuzzy Weighted Frequency Distributions; • Bar for category in histogram for cluster is Percentage sum of people for that category in entire sample factored by cluster membership
Results • Sequential Alignment • Low Vs High Gap Penalty Results • Cluster plot for 3 clusters Low Gap High Gap
Results • Shadow Plot • Low Gap High Gap • Use low Gap Penalty – consistent with recommendation (1 and .1)
Results • Number of Clusters • Clustal Plot Helps to See the potential range of number of clusters for Clustering
Results • Number of Clusters • Potential range 2 to 5
Results • Number of Clusters (k) • K=2 • Fk = 0.60 ASV = 0.42
Results • Number of Clusters (k) • K=3 • Fk = 0.43 ASV = 0.40
Results • Number of Clusters (k) • K= 4 • Fk = 0.34 ASV = 0.32
Results • Number of Clusters (k) • K= 5 • Fk = 0.28 ASV = 0.20
Results • Number of Clusters (k) ? • Use 3 clusters for testing • Expect different for total sample
Fuzzy Cluster Memberships • Output of S-plus software • HH2701 has almost equal memberships to all three clusters -
Results Fuzzy weighted frequency Distribution
Results Crisp presentation Cluster Interpretation
Results Cluster Interpretation - tends to be more; • Cluster 1 • Students age of 5 to 15 • Mainly KEJS and youths • Cluster 2 • Females • Seniors and other adults in Age range 66-70 • Retired home makers and volunteers • Cluster 3 • Males • 100% Adults workers • Age 40’s • Majority Adults workers not needing a car to work • Expect different for total sample
Conclusions • Methods seems to work well to identify the clusters as intended – no hurdles. • Fuzzy clustering better indicate strength of membership • Best to have multiple measures “quality” of clustering regarding number of clusters • Still work in progress • Results not complete – just for example • But essential elements of analysis process set
Conclusions • Future Work • Proceeding to full sample of 8,400 households including Weekends • Expanding to location dimension • Calibrate Logit model for allocation of clusters • Consider Household Structure