Download
1 / 62
620 likes | 721 Vues
The Findlay City Schools Community Attitudes Survey. Saperstein Associates, Inc. | Spring 2008. Introduction.

E N D
The Findlay City Schools Community Attitudes Survey Saperstein Associates, Inc. | Spring 2008
This research gives district residents a voice. It allows the voting public to express its opinions on myriad school-related issues – and, in doing so, provides the board and the administration valuable data as planning for the district’s future continues.
Methodology • Telephone interviews were conducted with a random sample of 505 registered voters, all of whom live in the Findlay City School District. • The interviews were conducted between May 13 and May 19, and average 17 minutes in length. • The findings presented throughout this report are accurate to +/- 4.4 percentage points at the 95 percent level of confidence. • The sample was developed from voting records provided electronically by the Hancock County Board of Elections and Ohio’s Secretary of State.
The interviews represent registered voters on several key dimensions, including gender, age, … Sample Population Gender Male 46% 46% Female 54% 54% Age 18 to 34 15% 14% 35 to 54 38% 37% 55 and older 47% 49%
… jurisdiction, and households with children younger than 18. Sample Population Jurisdiction Findlay 1 12% 11% Findlay 2 18% 21% Findlay 3 9% 10% Findlay 4 19% 16% Findlay 5 15% 15% Findlay 6 17% 19% Marion 7% 5% Liberty 3% 3% Children < 18 35% 29%* *2000 U.S. Census
More than nine out of ten voters agree that good public schools benefit everyone, not just families with school-age children. Good Schools Benefit Everyone Agree strongly 73% Agree moderately 22% Disagree moderately 4% Disagree strongly 1%
Nine out of ten voters also agree that strong schools increase property values. Strong Schools Increase Property Values Agree strongly 65% Agree moderately 28% Disagree moderately 4% Disagree strongly 2% No opinion 1%
Eight out of ten voters agree that when a school system begins to decline, local employers are more likely to leave the community because they find it more difficult to attract and retain qualified workers. Declining Schools May Cause Employers to Leave Agree moderately 39% Agree strongly 42% Disagree moderately 14% Disagree strongly 3% No opinion 2%
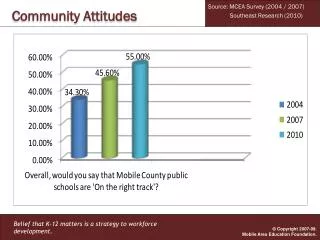
Two out of three voters rate the Findlay Schools excellent or good. Impressions of the Findlay Schools: Overall Good 52% Average 25% Fair 2% Poor 1% Excellent 15% No opinion 5%
Positive impressions of the Findlay Schools are especially common among parents of children enrolled in the schools. The difference, however, is not large. Impressions of the Findlay Schools Voters with children in the Findlay Schools Voters with no children in the Findlay Schools
Three out of ten voters feel the Findlay Schools are improving. Only one out of 12 feels the schools are declining. Quality of Education Getting worse 8% Improving 30% No opinion 9% Staying the same 53%
Again, positive impressions are slightly more common among parents. Findlay Schools are Improving Voters with children in the Findlay Schools Voters with no children in the Findlay Schools
More than half the voters praise the district for preparing students for college, hiring and keeping qualified teachers, providing for students with special needs, and teaching students to be tolerant. Impressions of the Findlay Schools: Academics Preparing students for college 73% Hiring and keeping highly-qualified teachers 66% Providing for students with special needs 60% Teaching students to be tolerant 57%
By contrast, fewer voters praise the district for preparing students for the 21st Century, preparing students who do not go to college, and providing students with enough personal attention. Impressions of the Findlay Schools: Academics Preparing students for the 21st Century 45% Preparing students who don’t go to college 42% Providing personal attention 40%
Two out of three voters feel that the balance between core subjects, such as reading and math, and other subjects, such as art and music, is just about right. The Balance Between Core Subjects and Other Subjects Too little on core subjects 15% About right 68% Too much on core subjects 7% No opinion/other 10%
Four out of ten voters feel there is too much emphasis on standardized testing – even though almost everyone knows that these tests are required by law. Standardized Testing Required by Law Amount of Emphasis Too little 5% Yes 94% About right 40% Too much 41% No 1% No opinion 14% Not sure 5%
More than half the voters see the emphasis on computers and technology as appropriate; many, however, have no opinion. Emphasis on Computers and Technology for Instructional Purposes About right 56% No opinion 22% Too little 19% Too much 3%
Two out of three voters see the emphasis on sports as just about right. One out of four, however, considers it too much. Emphasis on Sports About right 68% Too little 2% Too much 25% No opinion 5%
Nine out of ten voters feel that Findlay’s foreign language curriculum should include Spanish. Strong interest in Asian languages may speak to a recognized need for a 21st Century education. Foreign Language Priorities Spanish Japanese French Chinese Latin German . *Respondents selected three languages from six listed.
Three out of four voters praise the Findlay Schools for keeping students, teachers, and staff safe from violence. Fewer, though still a majority, praise the schools for maintaining discipline. Safety and Discipline Keeping students, teachers, and staff safe from violence 74% Maintaining discipline on school property 55%
Impressions of the Findlay Schools: Planning and Fiscal Issues
Half the voters praise the district’s performance planning for the future. Though three out of ten may not be impressed, few are critical. Planning for the Future Good 41% Excellent 10% Average 30% No opinion 11% Poor 1% Fair 7%
Half the voters also feel that the district is spending tax dollars responsibly. Here, however, slightly more are critical. Spending Tax Dollars Responsibly Good 40% Excellent 10% Average 27% No opinion 9% Poor 4% Fair 10%
Eight out of ten voters feel that, in light of the education students receive, tax dollars are well spent. Tax Dollars Well Spent Agree strongly 40% No opinion 1% Agree moderately 42% Disagree strongly 6% Disagree moderately 11%
Two out of five voters agree that the district communicates well with the entire community, including residents without school-age children. Communications Good 34% Excellent 10% No opinion 4% Average 37% Poor 3% Fair 12%
Voters with children enrolled in the Findlay Schools have more positive impressions of how the district communicates, but the difference is not large. Communications: Excellent or Good 44% All voters Parents 52% Not parents 41%
The Findlay Courier is the most common source of information about the schools. Sources of Information About the Findlay Schools Findlay Courier 73% Friends, family 25% 12% Children enrolled District newsletter 8% 8% Teachers Radio 7% District Web site 6%
One out of three voters has been to the district’s Web site during the past six months. Nearly all of those voters found it helpful. Visited the District’s Web Site Very helpful 36% No 67% Yes 33% Somewhat helpful 58% Not helpful 6%
Only one out of five voters knows the number of students enrolled in the Findlay Schools. Enrollment *Correct 18% Smaller 30% Larger 9% Not sure 43% *Correct = 5,000 to 7,500 (6,230)
Only one voter in eight knows the number of students in the average Findlay classroom. Most believe the average is higher. Average Class Size Larger 73% *Correct 14% Smaller 1% Not sure 12% *Correct = 15 to 20 (17.44)
Half the voters know that the Findlay Schools have earned a rating of “Effective” from the Ohio DOE. Rating by Ohio DOE Lower 28% *Correct 48% Not sure 16% Higher 8% *Correct = Effective (2006-07)
The typical voter knows only one of the three facts tested. Only one in a hundred knows all three. Accuracy Index 38% None correct 46% One correct 15% Two correct 1% Three correct Average correct = 0.8
The Findlay Schools: Priorities
Two out of three voters rate several priorities high, ... Priorities Making students, teachers, and staff safer from violence 69% Renovating or replacing older schools 64% Improving the quality of teachers 64% Improving the Millstream facilities 51% Investing more in computers and technology 47%
… however, a plurality feel that renovating or replacing older schools should be the highest priority. Highest Priority Renovating or replacing older schools 40% Improving the quality of teachers 22% Making students, teachers, and staff safer from violence 19% Investing more in computers and technology 10% Improving the Millstream facilities 8%
Six out of ten voters recognize the need for an operating levy to provide money for the district’s day-to-day operations. Support for an Operating Levy Recognize the need 59% No opinion 3% Now is not the time 38% These data were collected before the current 5.9 mill levy was placed on the November 4 ballot.
Support for a levy is strongest among voters younger than 55 and parents. Support for an Operating Levy All voters 59% Younger than 55 66% 65% Parents
Support for a levy is weakest among seniors and voters concerned about the financial future. Still, a majority of seniors support a levy. Support for an Operating Levy All voters 59% Seniors 51% Concerned about financial future 40%
Six out of ten voters recognize the need for a bond issue to renovate or replace older schools. Support for a Bond Issue Recognize the need 62% No opinion 3% Now is not the time 35%