Download
1 / 8
80 likes | 211 Vues
Chapter 4 Two-Variables Analysis. 09/19-20/2013. Outline. Issue: How to identify the linear relationship between two variables? Relationship: • Scatter Plot is a collection of observations on an X-Y graph

E N D
Chapter 4 Two-Variables Analysis 09/19-20/2013
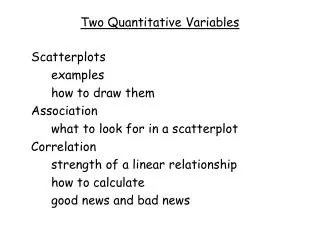
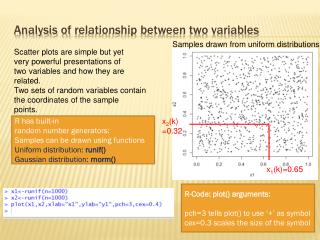
Outline • Issue: How to identify the linear relationship between two variables? • Relationship: • • Scatter Plot is a collection of observations • on an X-Y graph • • Covariance conveys the direction of the potential relationship • Correlation coefficient measures the strength of a linear relationship between two variables • Causality and predictions: • • Least squares line
Covariance • A measure of the strength of a linear relationship between two variables • While the magnitude changes with the units, its sign conveys direction only. • Positive covariance Positive linear relationship • Negative covariance Negative linear relationship
Correlation coefficient • Unit-free and always between -1 (perfectly negative linear relationship) and +1 (perfectly positive linear relationship) • The greater the absolute value of the correlation coefficient, the stronger the linear relationship.
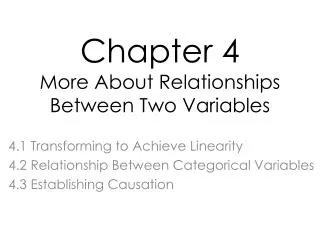
Least squares line • A Unique line that describes the relationship between two variables, when one causes the other. It has the smallest sum of squared error!
Sum of Squared Error is the observed value and is the predicted value.