Download
1 / 36
370 likes | 607 Vues
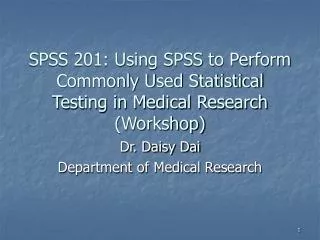
Tools of the Trade: An Introduction to SPSS. Presenter: Michael Duggan, Suffolk University Mduggan@suffolk.edu. Agenda for SPSS. What is SPSS? What can you do with SPSS? What I will show you today. SPSS stands for “Statistical Package for the Social Sciences”

E N D
Tools of the Trade: An Introduction to SPSS Presenter: Michael Duggan, Suffolk University Mduggan@suffolk.edu
Agenda for SPSS • What is SPSS? • What can you do with SPSS? • What I will show you today
SPSS stands for “Statistical Package for the Social Sciences” The SPSS home-page is: www.spss.com What is SPSS?
Run Frequencies Calculate Descriptive Statistics Compare Means Conduct Cross-Tabulations Recode Data Create Graphs and Charts Do T-Tests Conduct ANOVAs Run Various Type of Regressions And Much More! What can you do with SPSS?
What I will show you today!! • Bringing your data into SPSS • Recoding • SPSS uses for beginners • Admission • Financial Aid • Retention
Bringing your data into SPSS: 1. Go to “File” then “Open” and click on “Data”
2. Be sure that the “Files of type” is set on Excel (*.xls) 3. Click on the Excel File you want to open. 4. Either Double-Click the file name or click the “Open” button
5. Choose the name of the worksheet that your data is in. (You can only choose one worksheet at a time) 6. Click “OK”
If you look at the botton left, you’ll see tabs for Data View and Variable View
Data and Variable View Data View: Allows you to examine your actual data Variable View: Lets you review information about your variables. Is it a string or numeric variable? Are there labels for it? How are missing values handled? In Variable view, you can add labels to variables so your results will be easier to understand.
OK – let’s do something with the data. Click on “ANALYZE”, then “DESCRIPTIVE STATISTICS”
Descriptive Statistics –Frequencies: We’ll look at a variable called “enr” which shows whether an accepted student enrolled.
This is what the output looks like. About 26% of the accepted freshmen actually enrolled.
What else can you do with “Frequencies”? Percentiles, means, medians, and more.
Frequencies of SAT Math scores showing just statistics and percentiles.
Crosstabs- click on “Descriptive statistics” then “Crosstabs” then put in the variable you want for the row and the variable you want for the column. Click “Ok”.
To make “Cross-tabs” more useful, click on “cells” and “row percentage”. Then “continue” and “Ok”
Another name for this crosstab is Admissions Yield By Rating
Using “Compare Means” for Financial Aid Analysis. We are getting average institutional aid by admission rating for enrolling and non-enrolling students.
You could take that output and make a table like this one in Excel.
Recoding If you wanted to look at average financial aid award by rating and need level, you’d need to recode the need data into groups. You can decide what and how many need groups you are interested in. I’m going to use four groups to show you how the recode works. First, click on “Transform” then “Recode” then “Into Different Variables”
To recode “, select “Need”, type in a new name in “output variable” and add a label name if you want. Then click on “old and new values”
Type in the range of the “old value” and a “new value” for the need group. When done, click “continue”, then “Change” and “Ok”
Using SPSS for Retention Studies • The process for using SPSS in retention studies is very similar to the ones we’ve discussed so far. • Import your data into SPSS • Pick the variables and procedures that your are interested in. • We’ll be looking at a SPSS datafile on new FA’97 freshmen.
Retention: • Procedures: • Frequency – can tell in one “click” percent of students that were retained or have graduated • Cross-tabs – can compare retention or graduation rates for different groups of students. For example, by gender, race/ethnicity, rating, and so forth. • Of course, you need to have the data available from your student information system to do any of these analyses.
Here we have retention to the second (FA98) and retention to the fifth year (FA01)
If you want a copy of the powerpoint presentation – it will be posted to my office’s webpage at http://www.suffolk.edu/enrres/home.html under “Presentations”. If you can’t find it or have questions, try me at mduggan@suffolk.edu