Download

1 / 32
320 likes | 442 Vues
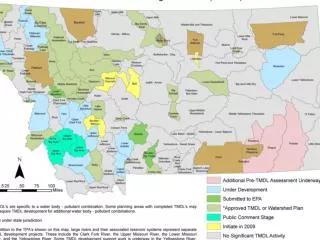
Chowan River TMDL Development Tidewater Area 08/26/04. Historical data analysis Source assessment Bacterial source tracking Modeling Allocation. TMDL Development. Fecal Coliform Impairments. Impaired Stream Segments in the Back Bay and North Landing River watersheds.

E N D
Chowan River TMDL Development Tidewater Area 08/26/04
Historical data analysis Source assessment Bacterial source tracking Modeling Allocation TMDL Development
Fecal Coliform Impairments Impaired Stream Segments in the Back Bay and North Landing River watersheds
Water Quality Data Analysis Location of VADEQ water quality monitoring stations in the Back Bay and North Landing River watersheds
Water Quality Data Analysis Fecal Coliform Concentrations
Water Quality Data Analysis E. coli concentrations for period July 2002 through March 2004
Water Quality Data Analysis • Statistical Analysis of Water Quality Measurements versus Precipitation to determine the relationship between rainfall and water quality • Summary of the Mood Median Test on mean monthly precipitation at station 444101 (p=0.013).
Source Assessment • Identification of Sources • DEQ/DCR/Locality records • Ag Census • Habitat Analysis • Stakeholders, local knowledge • BST • Source Characterization • Fecal production / densities / distribution • Delivery Mechanisms • Direct • Land-applied • Exported Out of Watershed • Temporal Variation
Two permitted dischargers – one in West Neck, one in Nawney Creek. Only one is currently active. Permitted Discharges * Farm no longer active
Sanitary sewer Overflows - reported to DEQ Exfiltration – rate from literature Failing septic systems Rate based on age of house Straight pipes U.S. Census and VDH consultation Human
Reported Sewer Overflows • Frequent overflows in West Neck Creek Drainage. • 55 events reported between July 1999 and May 2004. • Uncertainty as to whether all overflows are reported/observed. • Mean overflow volume of 109 gallons.
Livestock Average percentage of collected livestock waste applied throughout year
Bacterial Source Tracking Location of BST stations in the Back Bay and North Landing River watersheds
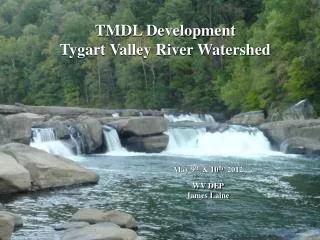
Modeling • Hydrologic model • Runoff model • HSPF • Water Quality model • Tidal/Estuary model • CE-QUAL-W2 • Model Calibration and Validation • Based on data availability, period of interest
Modeling VADEQ Station 5BWNC010.02 and USGS Station #02043200
Modeling VADEQ Station 5BMLD001.92 and USGS Station #02043200
Modeling VADEQ Station 5BNWN001.84 and USGS Station #02043200
Modeling VADEQ Station 5BNWN000.00 and USGS Station #02043200
Develop reduction scenarios that will meet water quality standards 100% reduction in straight pipes, 25% reduction in failed septic systems 100% reduction in straight pipes, 50% reduction in livestock direct deposition Allocate loads to each source Allocation