Download
1 / 16
160 likes | 298 Vues
Planificador por turnos. Está diseñado especialmente para sistemas de tiempo compartido. Se define un intervalo de tiempo denominado cuanto, cuya duración varía según el sistema . La organización de la cola es FIFO . Genera una interrupción cuando se agota el cuanto de tiempo .

E N D
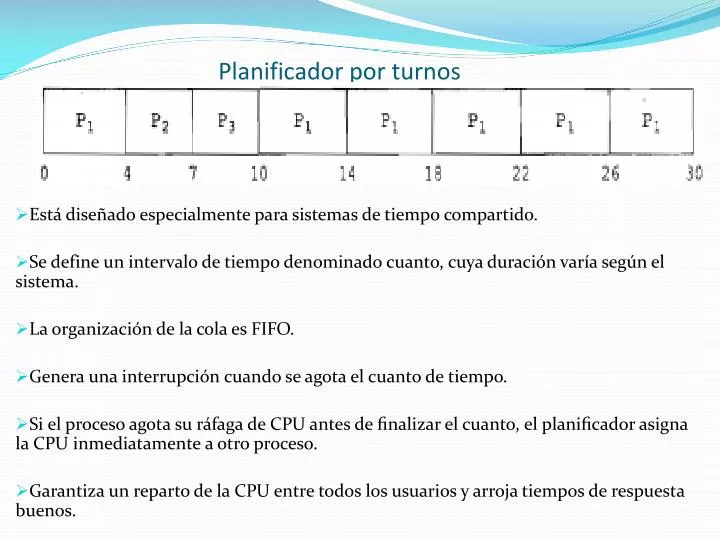
Planificador por turnos Está diseñado especialmente para sistemas de tiempo compartido. Se define un intervalo de tiempo denominado cuanto, cuya duración varía según el sistema. La organización de la cola es FIFO. Genera una interrupción cuando se agota el cuanto de tiempo. Si el proceso agota su ráfaga de CPU antes de finalizar el cuanto, el planificador asigna la CPU inmediatamente a otro proceso. Garantiza un reparto de la CPU entre todos los usuarios y arroja tiempos de respuesta buenos.
P1 P2 P3 P4 R=10 R=8 R=5 R=2 Q=4
P1 P2 P1 P2 P3 P4 R=10 R=10 R=8 R=5 R=2 Q=4 Q=4
P1 P2 P3 P4 R=10 R=8 R=5 R=2 Q=4 0 4
P1 P2 P3 P4 R=10 R=8 R=5 R=2 Q=4 0 4
P1 P2 P3 P4 R=10 R=8 R=5 R=2 Q=4 8 0 4
P1 P2 P3 P4 R=10 R=8 R=5 R=2 Q=4 8 0 4
P1 P2 P3 P4 R=10 R=8 R=5 R=2 Q=4 8 12 0 4
P1 P2 P3 P4 R=10 R=8 R=5 R=2 Q=4 8 12 0 4
P1 P2 P3 P4 R=10 R=8 R=5 R=2 Q=4 8 12 14 0 4
P1 P2 P3 P4 R=10 R=8 R=5 R=2 Q=4 8 12 14 18 0 4
P1 P2 P3 P4 R=10 R=8 R=5 R=2 Q=4 8 12 14 18 22 0 4
P1 P2 P3 P4 R=10 R=8 R=5 R=2 Q=4 8 12 14 18 22 23 0 4
P1 P2 P3 P4 R=10 R=8 R=5 R=2 Q=4 Diagrama de Gant 8 12 14 18 22 23 25 0 4
Diagrama de Gant 8 12 14 18 22 23 25 0 4 ECUACIONES TEP Y TRP • TIEMPO PROMEDIO DE ESPERA (T.P.E) • Para cada proceso se resta el tiempo en el que se ejecutó del tiempo en el que llegó. • TIEMPO PROMEDIO DE RETORNO (T.P.R) • Tiempo en el que termina de ejecutarse el proceso.
Diagrama de Gant 8 12 14 18 22 23 25 0 4 TIEMPO PROMEDIO DE ESPERA (T.P.E) P1 = 0 + 10 + 5 = 15 P2 = 4 + 10 = 15 P3 = 8 + 10 = 18 P4 = 12 60 TPE = 60 / 4 = 15 TIEMPO PROMEDIO DE RETORNO (T.P.R) P1 = 25 P2 = 22 P3 = 23 P4 = 14 84 TRP = 84 / 4 = 21