Download
1 / 23
230 likes | 237 Vues
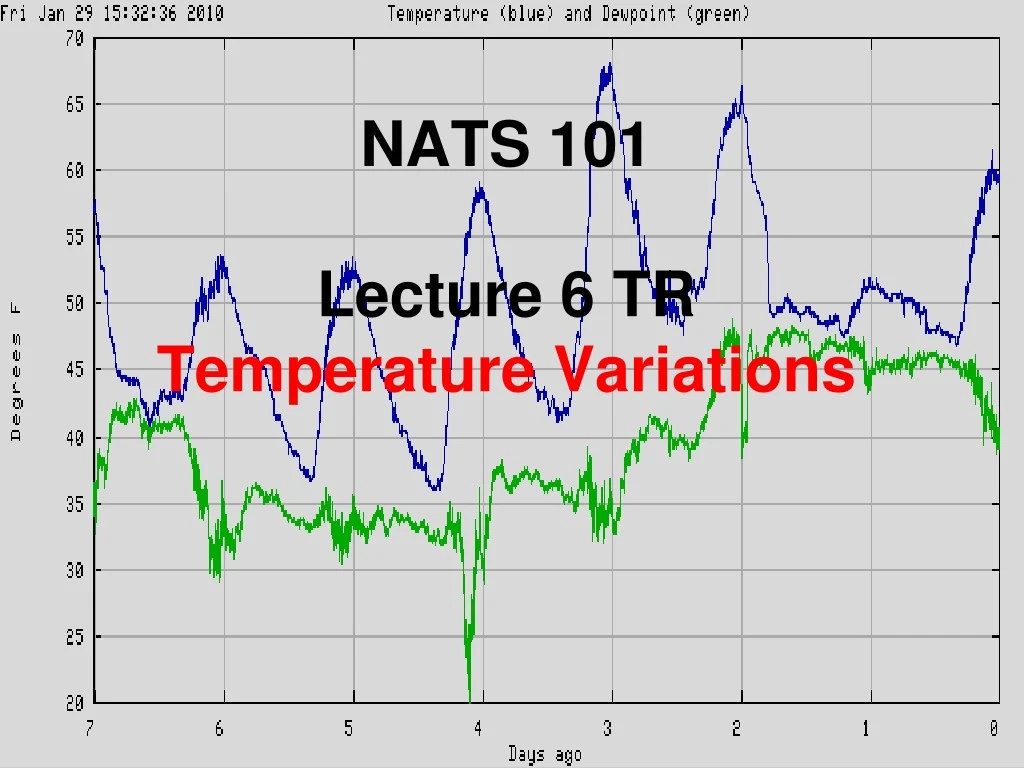
NATS 101 Lecture 6 TR Temperature Variations. Term Project. Term Project Description One of Two Options 1. Scientific analysis of one of two films on climate change. 2. Analysis of the daily afternoon weather for Tucson over a three-week period. Term Project. Recommendations

E N D
Term Project Term Project Description • One of Two Options 1. Scientific analysis of one of two films on climate change. 2. Analysis of the daily afternoon weather for Tucson over a three-week period.
Term Project • Recommendations • Start project very soon. Preferably now. • Scientific exchange with other students is OK, but the paper that you submit must be your own and reflect your final thoughts. • Turnitin software will be used to identify possible cases of plagiarism.
Temperature Questions • What causes diurnal temperature variations? • What physical processes can influence daily temperature variations? • Why is MAX temperature after solar noon? • Why is MIN temperature just after sunrise? • What is Wind Chill Factor? (if time allows)
MAX Temperature near Surface Ahrens, Fig 3.1 1) Solar SW 3) Convection 2) Conduction 4) Air near ground is heated the most
MIN Temperature near Surface 1) Outgoing Infrared Ahrens, Fig 3.3 3) Absorbed & Re-emitted Infrared 2) Conduction INVERSION – Temp increases w/height 4) Air near ground is cooled the most
Ahrens, Fig 3.10 Daily Range of Temperatures MAX-MIN difference decreases with height above ground
12 and 00 UTC TUS Sounding MAX-MIN Range 0oC at 700 mb-2400 m 2oC at 850 mb-800 m 6oC at 910 mb-150 m 12oC at 925 mb-ground Range decreases with height isobars isotherms Diurnal Range Inversion-Warmer with Height Rapid Cooling with Height
Growth and Decay of InversionEveningMorning Height Height t4 t4 t3 t2 t3 t1 t2 t1 Temperature Temperature Cooled the most at the ground level Warmed the most at the ground level
Warm Cold Absorption Re-Emission Weak IR Strong IR Mixing with Fast Winds What Affects Inversion Strength? Cloud Cover Clear skies-strong inversion Cloudy skies-weak inversion Land Characteristics Snow cover-strong inversion Bare ground-weaker inversion Wind Speed Calm winds-strong inversion Strong winds-weak inversion
When Does MAX-MIN Occur? When incoming Solar exceeds outgoing IR Temperature rises When outgoing IR exceeds incoming Solar Temperature falls When outgoing IR equals incoming Solar Temperature constant MAX occurs Late afternoon MIN occurs Just after sunrise Ahrens, Fig 3.2
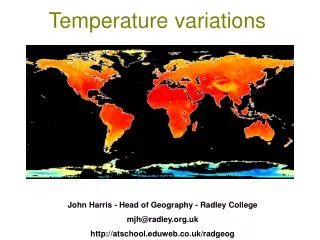
Winter-Summer Temperature Variations at Sea Level DJF 100oF 10oF Continents undergo larger changes than oceans High latitudes undergo larger changes than low latitudes JJA Ahrens, Figs. 3.8, 3.9
Controls of Temperature • Latitude Average temperatures in middle latitudes change by 5-10oC every 10o latitude change • Elevation Lapse rate in troposphere is 6.5oC/km Tucson (2,500 ft) July Max - 100oF Mt. Lemmon (8,500 ft) July Max - 76oF
Controls of Temperature • Ocean Currents and Prevailing Winds Warm-Gulf Stream Cold-California Current • Land versus Water Heat capacity of water is 5X that of land Absorbed solar energy is distributed a greater depth in water than in land
Specific Heat Capacity Heat required to raise the temperature of 1 gm of mass 1oC. Water has higher heat capacity than rock. Still water warms or cools very slowly compared to air and land
Water-Soil Heating Depth Consider the Fate of Incoming Solar Radiation Penetrating Water vs. Soil Deep Penetration Shallow Penetration Convective Mixing Conduction No mixing Small Heat Capacity Large Heat Capacity Small warming over great depth Large warming in shallow layer
Wallace and Hobbs Soil Temperature
Ocean Temperature Wallace and Hobbs
Wind Chill Still air is poor conductor; lack of wind allows insulating layer of still air to form next to skin Wind blows insulating layer of air from skinForced convection or heat transport by advection
The main reason for seasons is? • Eccentricity of the earth’s orbit • Tilt of the earth’s axis (obliquity of the ecliptic) • Precession of the equinox • Millennium variations in earth-to-sun distances at aphelion and perihelion
Which statement is not a reason that coastal sites experience less extreme seasons than inland sites? • Water has a higher heat capacity than soil • Convective heat transfer is far more efficient in water than soil • Water has a higher thermal conductivity than soil • Sunlight penetrates deeper into water than soil
Summary • Balance between incoming and outgoing energy controls temperature rises and falls MAX late afternoon, MIN just after sunrise • Diurnal temp. changes are largest at ground Affected by wind, cloud cover, land type • Winter-Summer differences Largest over land, high latitudes • Temperature controls Latitude, Altitude, Land-Sea, Ocean Currents
Next Class AssignmentAtmospheric Moisture • Reading - Ahrens 3rd-Pg: 75-86, B: 426, D: 429-432 4th-Pg: 77-89, B: 430, D: 433-436 5th-Pg: 79-91, B: 440, D: 443-446 • Homework03 - D2L (Due Monday Feb 8th) 3rd-Pg 106: 4.1, 4.2, 4.5, 4.6, 4.9, 4.10 4th-Pg 108: 4.1, 4.2, 4.5, 4.6, 4.9, 4.10 5th-Pg 108: 4.1, 4.2, 4.5, 4.6, 4.9, 4.10