Download
1 / 17
170 likes | 172 Vues
VLBI Observations of IDV Sources. Brian Moloney Dr. Denise Gabuzda University College Cork. Summary. What is IDV?. Intra-Day Variability: Rapid variations in the I and/or P flux on a timescale of hours How is it caused? Intrinsic Extrinsic. Intrinsic. Within the source

E N D
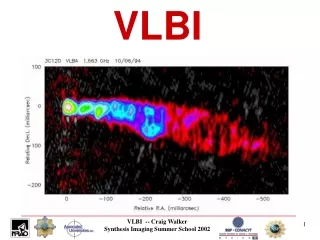
VLBI Observations of IDV Sources Brian Moloney Dr. Denise Gabuzda University College Cork
What is IDV? • Intra-Day Variability: Rapid variations in the I and/or P flux on a timescale of hours How is it caused? • Intrinsic • Extrinsic
Intrinsic • Within the source • Implies compact size • Unfeasibly high Brightness Temperature • 1017 K which exceeds the Inverse Compton Limit of 1012 K.
Extrinsic • Outside the source • Similar to twinkling stars
Previous Results • J1819+3845’s IDV behaviour has been proven to arise due to Extrinsic effects. How? • Annual cycle • Time delay between 2 antennas Dennett-Thorpe J., De Bruyn A.G. 2003, A&A, 404, 113 Dennett-Thorpe J., De Bruyn A.G. 2002, Nature 415, 57
My Experiment Set of IDV sources in which the cause of variability is not yet certain. Observed at 8 & 15 GHz in 1997 VLBA + VLA
My Sources • 0917+624 • 0954+658 • 1150+812 • 2007+777 • 1642+690 • 0804+499
Plan • Use VLA data to determine behaviour • Use all I data to make VLBA map, then create slices in time of P data • PVLA - PVLBI should be constant • Identify if variability can be attributed to a certain area of polarisation on VLBI scales • Analyse properties of varying region
Future Work • More detailed analysis for 0917, 1642 • Analyse time slices for other sources • Model-fitting P data for time slices to better identify varying component and estimate its properties • Compare results with expected behaviour for scintillation
Acknowledgements • UCC Radio Astronomy Lab • The Audience