Download
1 / 12
120 likes | 268 Vues
Estimating Abundance Weight Sub-sample. Used to estimate total number in a sample Method: Weigh a known number of individuals to get a mean weight Weigh the entire sample, then divide the total weight by mean weight to get total number of individuals. Example:

E N D
Estimating AbundanceWeight Sub-sample • Used to estimate total number in a sample • Method: • Weigh a known number of individuals to get a mean weight • Weigh the entire sample, then divide the total weight by mean weight to get total number of individuals. • Example: • 10 individuals weigh 68g, so mean weight = 68 / 10 = 6.8 • Total weight = 528, so total number = 528 / 6.8 = 77.6 individuals
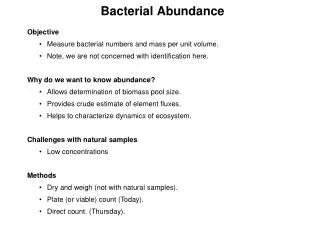
Capture-recapture Method • Important tool for estimating density, birth rate, and death rate for mobile animals. • Method: • Collect a sample of individuals, mark them, and then release them • After a period, collect more individuals from the wild and count the number that have marks • We assume that a sample, if random, will contain the same proportion of marked individuals as the population does • Estimate population density
Marked animals in second sample (R) Marked animals in first sample (M) Total caught in second sample (C) Total population size (N) 5 16 20 N = N = 64 Peterson Method – Single Census = = Proportions
Assumptions For All Capture-Recapture Studies • Marked and unmarked animals are captured randomly. • Marked animals are subject to the same mortality rates as unmarked animals. The Peterson method assumes no mortality during the sampling period. • Marked animals are neither lost or overlooked.
Example A fish biologist goes out and samples (sample 1) a population of trout. A total of 109 (M) trout were marked and released. At this time, a proportion of fish in the total population has a mark and we assume that this proportion remains constant. On a second sampling trip (sample 2), the biologist collected 177 (C) trout and 57 (R) of those were marked from the initial sample. How large is the population (N)? R/C = M/N N=MC/R N = (109)(177)/57 N=338
Si Zi Mi= + mi Ri Mi = Marked population size at time i mi = Marked animals actually caught at time i Ci =Total number of animals caught at time I Si / Ri = proportioncaught Si = Total animals released at time i Zi = Number of individuals marked before time i, not caught in the ith sample but caught in a sample after time i Ri = Number of the Si individuals released at time i that are caught in a later sample
Estimate Pop. Size at Time 3 Si Zi Mi= + mi Ri M3 = {(164)(39)/(54)} + 37 = 155.4 S3 = 164 C3 = 169 Z3 = 5+2+2+18+8+4 = 39 R3 = 33+13+8 = 54 m3 = 37 Population Estimation: N3=M3C3/m3 = (155.4)(169)/37 = 710
Estimate Pop. Size at Time 4 Si Zi Mi= + mi Ri M4 = {(202)(37)/(50)} + 56 = 205.5 S4 = 202 C4 = 209 Z4 = 2+2+8+4+13+8 = 37 R4 = 30+20 = 50 m4 = 56 Population Estimation: N4=M4C4/m4 = (205.5)(209)/56 = 767
Estimating mortality: We can compare the estimated number of marks in the wild versus a known amount to get mortality rates. For example, in year 3 we estimated that there were 155 marked individuals. We released a total of 132 newly marked individuals, for a total of 287 marked individuals. We estimated the number of marked individuals to be 206 for year 4. 206 is less than 287, so the survival rate is 206/287=0.718. Mortality is then 1-0.718=0.282. Survival3 = Number Marks Estimated3 / Total Marks Released Survival3 = 206 / 287 = 0.718 Mortality3 = 1 – Survival3 = 1 – 0.718 = 0.282
Estimating Natality: We estimated that our mortality from year 3 4 was 28%, but our population estimation increased by 57 individuals from 710 to 767. Given an initial population of 710 (N3) and mortality of 28%, we should only have 511 (710-0.28*710) individuals in the population for year 4. However, our estimated population size in year 4 is 767, 256 more individuals than 511. So, we had 256 individuals added to the population! N3 = 710, 28% Mortality3 = (710)(0.28) = 199 Expected N4 = 710 – 199 = 511 Estimated N4 = 767 Therefore, 767 – 511 = 256 new individuals
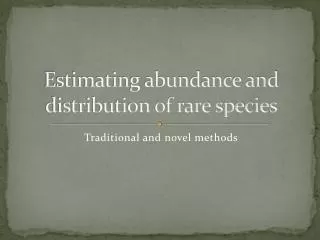
Quadrant Estimation • Individuals evenly spread over a known area • Use a known area quadrant to sample • Determine the mean number per square area • Multiply times total area to get total number of individuals