Download
1 / 21
210 likes | 501 Vues
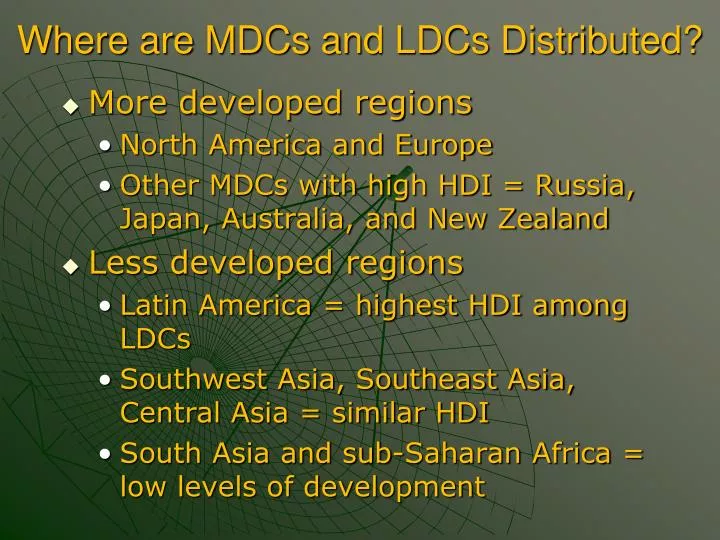
Where are MDCs and LDCs Distributed?. More developed regions North America and Europe Other MDCs with high HDI = Russia, Japan, Australia, and New Zealand Less developed regions Latin America = highest HDI among LDCs Southwest Asia, Southeast Asia, Central Asia = similar HDI

E N D
Where are MDCs and LDCs Distributed? • More developed regions • North America and Europe • Other MDCs with high HDI = Russia, Japan, Australia, and New Zealand • Less developed regions • Latin America = highest HDI among LDCs • Southwest Asia, Southeast Asia, Central Asia = similar HDI • South Asia and sub-Saharan Africa = low levels of development
More and Less Developed Regions Fig. 9-8: The less developed regions include Latin America, Sub-Saharan Africa, Middle East, South Asia, East Asia, and Southeast Asia.
Air Pollution in Eastern Europe Fig. 9-1-1: Sulfate emissions in the Czech Republic and Slovakia. GIS was used to map previously secret data on air pollution after the fall of the communist regime. Extremely high levels were found in some of the main industrial areas.
China • China, the largest country in East Asia, ranks among the world’s poorest. • Within a few years China is projected to exceed the United States as the world’s largest economy, although the U.S. economy would still be much larger on a per capita basis.
The Middle East • Much of the Middle East is desert that can sustain only sparse concentrations of plant and animal life. • Most products must be imported. Because of petroleum exports, the Middle East is the only one of the nine major world regions that enjoys a trade surplus. • Government officials in Middle Eastern states, such as Saudi Arabia and the United Arab Emirates, have used the billions of dollars generated from petroleum sales to finance economic development. • Many Middle Eastern countries . . . prevent diffusion of financial practices that are considered incompatible with Islamic principles.
Middle East Continued • The low level of literacy among women is the main reason the United Nations considers the development among these petroleum-rich states to be lower than the region’s wealth would indicate. • To shed more light on the Middle East’s lagging development record, the United Nations uses a team of Arab social scientists to construct an Alternative Human Development Index (AHDI). • The AHDI points to three causes in the region’s relatively low HDI: lack of political freedom, low education and literacy rates, and lack of opportunities for women.
South Asia • South Asia includes India, Pakistan, Bangladesh, Sri Lanka, and the small Himalayan states of Nepal and Bhutan. • The region has the world’s second-highest population and second-lowest per capita income. • India.. is the world’s leading producer of jute,.. . peanuts, sugarcane, and tea. • India has (multiple) mineral reserves. • However, the overall ratio of population to resources is unfavorable. • India is one of the world’s leading rice and wheat producers. The region was a principal beneficiary of the Green Revolution. • Agricultural productivity in South Asia also depends on climate. • Agricultural output declines sharply if the monsoon rains fail to arrive.
Minerals in Africa Fig. 9-9: Although several African countries have important minerals, the world prices of many of these have lagged the prices of industrial products, services, and energy.
Sub-Saharan Africa • Despite these assets, sub-Saharan Africa has the least favorable prospect for development. • And economic conditions in sub-Saharan Africa have deteriorated in recent years. • Some of the region’s economic problems are a legacy of the colonial era.
Where Does Level of Development Vary by Gender? • Gender-Related Development Index (GDI) • Compares the level of women’s development with that of both sexes • Four measures (similar to HDI): • Per capita female incomes as a percentage of male per capita incomes • Number of females enrolled in school compared to the number of males • Percent of literate females to literate males • Life expectancy of females to males
Gender-Related Development Index (GDI) Fig. 9-10: The GDI combines four measures of development, reduced by the degree of disparity between males and females.
Economic Indicator of Gender Differences Fig. 9-11: Women’s income is lower than men’s in all countries, but the gender gap is especially high in parts of the Middle East, South Asia, and Latin America.
Gender Differences in School Enrollment Fig. 9-12: As many or more girls than boys are enrolled in school in more developed countries, but fewer girls than boys are enrolled in many LDCs.
Male Literacy Rates Fig. 9-13b: There is a gap in literacy rates between MDCs and LDCs as well as between men and women in many LDCs.
Female Literacy Rates Fig. 9-13a: Female literacy is lower than male literacy (Fig. 9-13b) in many LDCs, with significant gender gaps in parts of the Middle East, Africa, and South Asia.
Life Expectancy and Gender Fig. 9-14: Women’s life expectancy is several years longer than men’s in MDCs, but only slightly longer in many LDCs.
Gender Empowerment Measure (GEM) Fig. 9-15: The GEM combines two measures of economic power and two of political power by women. (Little data are available for LDCs.)
Women Professional and Technical Workers Fig 9-16: Half or more of professional and technical workers are women in most MDCs and some LDCs, such as Brazil, but only a small proportion are women in most LDCs.
Women Administrators and Managers Fig. 9-17: More than one-third of top administrators are women in North America and some other MDCs and LDCs, but 20% or fewer top administrators are women in many other countries.
Women as Legislators Fig 9-18: Over 20% of legislative seats are held by women in China, some European nations, and several LDCs. In many other LDCs, under 10% are held by women.
Income and Demographic Change, 1980–2004 Fig. 9-19: Per capita GDP has increased more in MDCs than in LDCs during this period, while population growth and infant mortality have declined more rapidly in MDCs than in LDCs.