Download
1 / 39
600 likes | 1.38k Vues
Functional Testing of the Eye: Clinical Electrophysiology of Vision. Matthew L. Severns, Ph.D. LKC Technologies, Inc. USA. Electrophysiology and Psychophysics. Electrophysiology tests record the electrical responses generated by the eyes or visual cortex

E N D
Functional Testing of the Eye: Clinical Electrophysiology of Vision Matthew L. Severns, Ph.D. LKC Technologies, Inc. USA
Electrophysiology and Psychophysics • Electrophysiology tests record the electrical responses generated by the eyes or visual cortex • Psychophysical tests measure the patient’s responses through mental process and behavior • Both are functional tests, but electrophysiology is objective and psychophysics is subjective • We will focus on electrophysiology tests
Common Visual Electrodiagnostic Tests • ERG (Electroretinogram) • Ganzfeld • Pattern • Multifocal • EOG (Electro-oculogram) • VEP/VER (Visual Evoked Potential/Response) • Pattern • Flash
ERG: Functional Testing of Retina • A flash of light will elicit an electrical response from the retina • The response can be recorded by placing electrodes on the surface of eye • The recorded response is weak and needs to be amplified • Recorded data can be stored and analyzed on a computer
Amp. Reference Electrode Computer Recording Electrode Ground Electrode ERG Response Ear Ganzfeld Dome ERG Recording Setup
Typical ERG Response B-Wave A-Wave • A-Wave: Mostly due to Photoreceptor activity (outer retina) • B-wave: Mostly due to On- and Off- Bipolar and Müller cell activity (inner retina)
The Origin of A-Wave • The photoreceptor cells are hyper-polarized in response to a flash stimulus, causing the negative A-wave • Dim flash does not elicit an A-wave early enough to be recorded • The early part of the A-wave is a direct measure of function of the photoreceptor cells including the Transducin (G-protein) cascade
The Origin of B-Wave • Photoreceptors trigger the On- and Off- Bipolar cells • Bipolar cell depolarization causes extracellular K+ changes, which trigger Müller cell membrane potential changes • Most of the B-wave is caused Bipolar and Müller cells • Because the ratio of Rods vs Cones is about 13:1, scotopic B-wave is a measure of the response from the Rod system, especially for dim flash
ERG: Test Procedure • Dilate the pupil with mydriatic to maximize the light entering the eye and minimize the interference from pupil contraction • Dark adapt > 25 minutes to maximize the rod responsiveness • Connect the electrodes: • Corneal electrodes on eyes • Reference electrode on forehead • Ground on ear
ERG-Jet Burian-Allen DTL ERG:Recording Electrodes Commonly used corneal electrodes:
ISCEV ERG Protocol: Step #1“Rod Response” • Patient is dark adapted, and there is no background light when ERG is recorded. The response is “Scotopic” • A dim flash stimulus (-24 dB) activates Rod photoreceptor cells but not Cones. Only B-wave response is recorded • Useful for the evaluation of Rod function
ISCEV ERG Protocol: Step #2“Maximal Response” • Patient remains dark adapted, and so the response is also Scotopic • Standard flash stimulus (0 dB) activates both Rods and Cones • The response contains both A-wave and B-waves • In normal retina, this stimulus intensity elicits the maximal response
Unfiltered ERG LKC software provides automatic analysis of Oscillatory Potentials Filtered ERG ICSEV ERG Protocol: Step #3“Oscillatory Potentials” • Same stimulus as Step #2 also elicits Oscillatory Potentials (OPs), which ride on the ascending B-wave • OPs have frequency range of 100-160 Hz • Affected by retinal ischemia: • Diabetics, CRVO have reduced OP Amplitude • OP Amplitude predicts high-risk diabetic patients
ICSEV ERG Protocol: Step #4“Cone Response” • The patient is exposed to background light (30 cd/m2) and then stimulated with a standard flash (0 dB), “Photopic” • The Rod photoreceptors are bleached by the background light, so response from Rods is suppressed • The response is mainly from Cone photoreceptors
ICSEV ERG Protocol: Step #5“Flicker Response” • Flicker stimulation (15-60 Hz) at the standard intensity (0 dB) with background on elicits photopic response • The B-wave from Cones is recorded, primarily inner retinal response • Applications: Retinal Ischemia; cone and rod-cone disorders LKC software provides automatic analysis of Flicker ERG
ERG: Clinical Applications • Helps Diagnose: • Retinitis Pigmentosa and other inherited retinal degenerations • Congenital and acquired night blindness • Inflammatory conditions (AZOOR, MEWDS) • Vitamin A deficiency • Helps Manage: • Diabetic Retinopathy • Central and Branch Vein or Artery Occlusion • Monitor retinal toxicity of drugs such as Plaquenil, Quinine, Cisplatin, Vigabatrin • Helps Prognosis: • Ocular trauma • Detached Retina
ERG: Additional Tests • Pattern ERG • Important point: Patient need to be refracted using tri-lenses. Use temporal fossa for reference electrode, and forehead for ground electrode. • Recording electrode: DTL or Gold Foil Electrode (no lens electrode) • Generated by retinal ganglion cells • Glaucoma evaluation • Macular dysfunction • Very bright flash (+25dB) test for pre-operative evaluation • Dense cataract • Vitreous hemorrhage
ERG: Additional Tests • Photopic Negative Response ERG • Test condition: Dilated, photopic test • Stimulus: Red Flash on Blue Background • Generated by retinal ganglion cells • Early glaucoma evaluation • On/Off Response ERG • Test condition: Dilated, photopic test • Stimulus: Red Flash on Blue Background • Looking at On and Off Bipolar Cells responses • Inner retina dysfunction • S-Cone ERG • Test condition: Dilated, photopic test • Stimulus: Blue Flash on Amber background • Generated by S-Cone Photoreceptors • Enhanced S-Cone Syndrome
ERG: Additional Tests - Research • Scotopic Threshold response ERG • Test condition: Dilated, scotopic test • Stimulus: Series of flash of increasing intensity starting from below threshold (starting intensity is species dependent) • Double Flash ERG • Stimulus: Bright Flash followed by medium flash
EOG: The Electro-Oculogram • Records the standing potential between the front and back of eye • Also called “Corneo-Fundal Potential” • Measures function of Retinal Pigment Epithelium (RPE) • Amplitude of potential changes with retinal illumination over a period of minutes • Dark: smaller potential • Light: larger potential
EOG Testing: First Steps • Pupil dilation and dark adaptation are not required for EOG test • Connect electrodes to inner and outer canthii: EOG electrodes • Patient looks side to side at alternating lights • LKC system automatically measures the potentials, and analyzes EOG data
EOG: Recording Phases • Three phases are typically recorded in EOG • The pre-adapt light phase is to standardize the standing potential, taking 1-5 min. • The dark-adapt phase is to “discharge” the standing potential, taking 10 - 20 min. • The light phase is to “recharge” the standing potential, taking 4 - 10 min. • The test takes about 30 - 40 min in total. Recording of both eyes are recommended to save time
EOG: A Normal Recording Arden Ratio: Light / Dark > 2.0 is OK
EOG: Clinical Applications • Most commonly used in Best’s Disease (Best’s Vitelliform Macular Dystrophy) • ERG Normal, EOG Abnormal is CONFIRMING diagnosis • Abnormal EOG even in patients with no symptoms of the disorder • Abnormal EOG also found in: • Retinal pigmentary degenerations • Chorioretinal dystrophies (e.g. choroideremia)
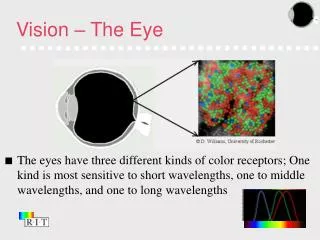
VEP: Visual Evoked Potential • Measures function of visual pathway: fovea, optic nerve, primary visual cortex • Pattern or Flash Stimulus • Normally use pattern stimulus (less variability) • Alternating grating, sinusoid, or checkerboard pattern • Stimulus may be full field or hemi-field • Record signals at visual cortex
Ground Electrode Recording Electrode Reference Electrode Amp. Computer VEP: Electrode Placement
VEP: Recording Procedure • VEP response is very small, about 20V or less, and spontaneous brain activity and EMG may dominate the individual responses • Need to average 50-100 responses to remove noise and reveal the underlying response • Artifacts caused by head movements may distort the recording, and so the sweeps contaminated with artifact should be rejected. LKC software automatically does this. • For Pattern VEP • Patient should be properly refracted (near correction) • For Flash VEP • Must patch contralateral eye to avoid artifacts
P100 ( 100 ms) Pattern VEP: A Normal Recording
Pattern VEP: Applications • Optic Nerve Disorders: • Optic neuropathy (compressive, ischemic) • Optic nerve atrophy • Compressive tumors • Demyelinating disease (e.g., Multiple Sclerosis) • Toxic optic neuropathies (ethambutol, cisplatin) • Malingering, hysterical blindness • Can use hemifield stimulation to distinguish pre-chiasmal from post-chiasmal effects
Flash VEP: Applications • Assessing visual function behind media opacities • Surgical monitoring • Intraorbital surgery with risk for optic nerve damage • Endoscopic sinus surgery
Multifocal ERG (MFERG): Mapping of Retinal Function • MFERG tests individual retinal areas in central 30° area • Stimulation is provided by video display • Sophisticated algorithms extract the response of each retinal area from the overall recording • Photopic test (cone function) • Response amplitude related to cone density. Typically, stimulus areas are scaled to provide equal response.
Amp. Reference Electrode Computer Recording Electrode Ground Electrode Ear MFERG: The Concept Stimulus on high-quality video monitor
MFERG: The Individual Response and 3-Dimensional Display Blind spot Foveal peak Focal ERG from each retina area 3D display of ERG response density
MFERG: Map And Focal • Analyze summarized ERG responses from different regions • Analyze the overall response from the central retina area of 50 - 600 view angle
MFERG: Recording Procedure • Dilate patient’s pupil with a mydratic. No dark adaptation is necessary. • Refractive correction is recommended but not required. • Recording using Burian-Allen or DTL electrode on the eye, a reference electrode (only for DTL), and a ground electrode • The test is composed of several segments, 10 - 30 seconds each, and total recording time is 5 - 10 minutes per eye • It is critical that patient is staring at the fixation during recording; the eye can be monitored using a fixation camera • Eye or body movement will distort the recording, and the segments should be repeated if there is too much noise
MFERG: Applications • Diagnosing macular disease: • ARMD, others • Retinal toxicity (Plaquenil and other drugs) • AZOOR (Acute Zonal Occult Outer Retinopathy) • Macula vs optic nerve in unexplained visual loss • Early diagnosis of retinal disease: Many retinal disorders affect small areas in early stages • Diabetic retinopathy • Retinitis pigmentosa
Conclusions • Visual Electrodiagnostic testing provides a way to measure the function of the retina and the visual pathway. • The functional examination is at the cellular level, and the recordings can be further studied with morphological data. • Clinical applications of visual electrophysiology are broad, and researches are being carried out for more applications. • LKC Technologies, the leader in diagnostic electrophysiology of vision, has been providing high quality techniques and products for nearly 30 years.
Thank You! LKC Technologies, Inc. 2 Professional Drive Gaithersburg, MD 20879 USA Tel.: +1-301-840-1992 Website: www.lkc.com