Download
1 / 1
10 likes | 123 Vues
Fig. 2: The relative size of the discovered network as the function of the density of source and target nodes in an evolving (Barab á si-type) network. Fig. 1: Schematic sketch of the exploration of the Internet from source and target nodes.

E N D
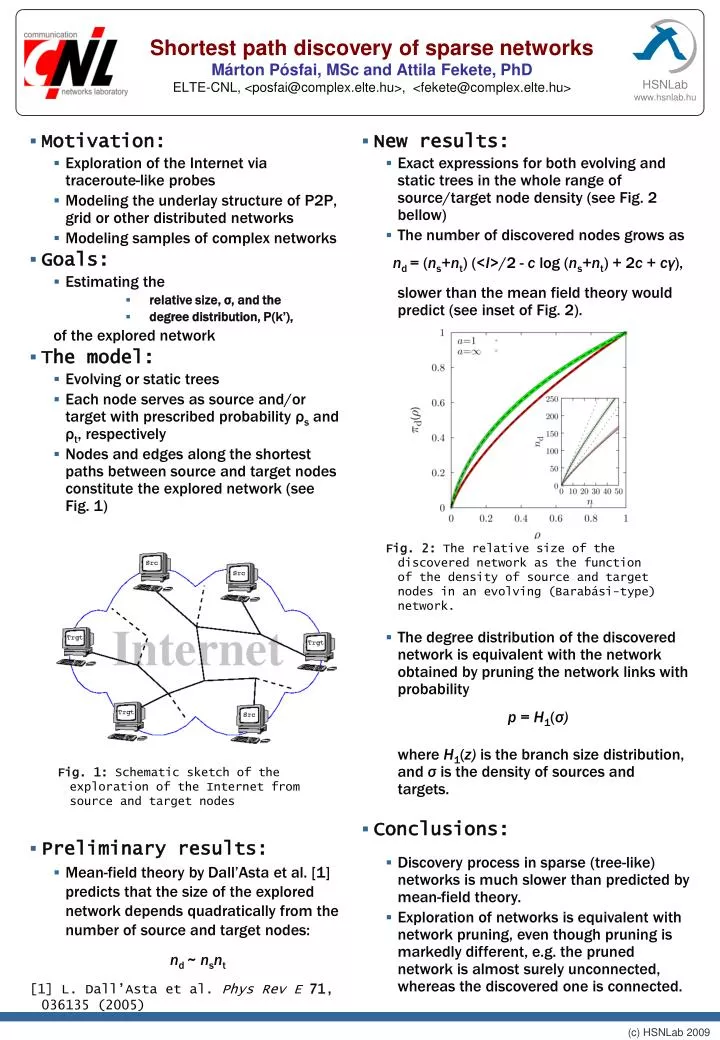
Fig. 2: The relative size of the discovered network as the function of the density of source and target nodes in an evolving (Barabási-type) network. Fig. 1: Schematic sketch of the exploration of the Internet from source and target nodes Shortest path discovery of sparse networksMárton Pósfai, MSc and AttilaFekete, PhDELTE-CNL, <posfai@complex.elte.hu>, <fekete@complex.elte.hu> • New results: • Exact expressions for both evolving and static trees in the whole range of source/target node density (see Fig. 2 bellow) • The number of discovered nodes grows as nd = (ns+nt)(<l>/2 - c log (ns+nt) + 2c + cγ), slower than the mean field theory would predict (see inset of Fig. 2). • Motivation: • Exploration of the Internet via traceroute-like probes • Modeling the underlay structure of P2P, grid or other distributed networks • Modeling samples of complex networks • Goals: • Estimating the • relative size, σ, and the • degree distribution, P(k’), of the explored network • The model: • Evolving or static trees • Each node serves as source and/or target with prescribed probability ρs and ρt, respectively • Nodes and edges along the shortest paths between source and target nodes constitute the explored network (see Fig. 1) • The degree distribution of the discovered network is equivalent with the network obtained by pruning the network links with probability p = H1(σ) where H1(z) is the branch size distribution, and σ is the density of sources and targets. • Conclusions: • Discovery process in sparse (tree-like) networks is much slower than predicted by mean-field theory. • Exploration of networks is equivalent with network pruning, even though pruning is markedly different, e.g. the pruned network is almost surely unconnected, whereas the discovered one is connected. • Preliminary results: • Mean-field theory by Dall’Asta et al. [1] predicts that the size of the explored network depends quadratically from the number of source and target nodes: nd ~ nsnt [1] L. Dall’Asta et al. Phys Rev E71, 036135 (2005)