Download
1 / 18
180 likes | 308 Vues
Three-State Study First Use Test Case. Gail Tonnesen, EPA Region 8. Three-State Study Technical Workshop Ft Collins, Colorado, May 29, 2013. Acknowledgments. 3SDW, WRAP , CDPHE, RAQC, ENVIRON, Alpine Geophysics. 3-state study test case. Simulation performed on EPA cluster at RTP

E N D
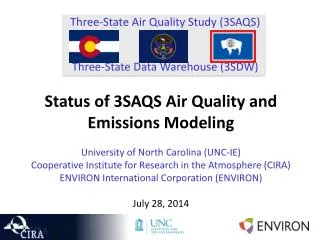
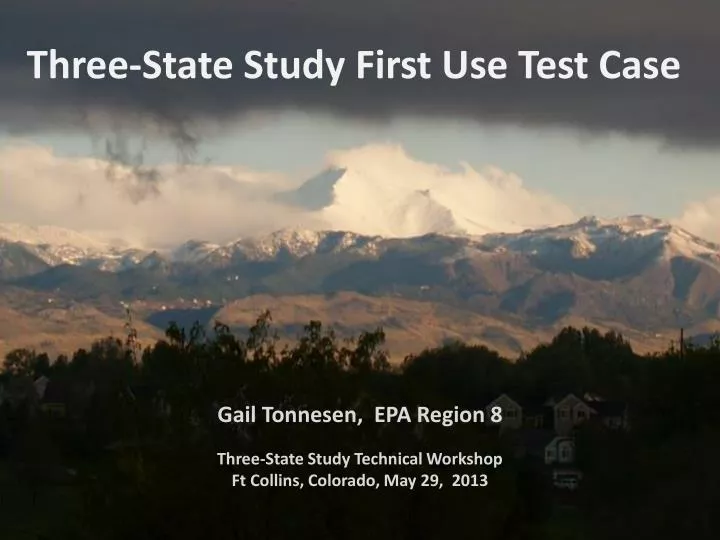
Three-State Study First Use Test Case • Gail Tonnesen, EPA Region 8 • Three-State Study Technical Workshop Ft Collins, Colorado, May 29, 2013
Acknowledgments 3SDW, WRAP, CDPHE, RAQC, ENVIRON, Alpine Geophysics
3-state study test case • Simulation performed on EPA cluster at RTP • Intel compiler, CAMx version 5.40 • updated with patch for point source emissions • run time of 2 hours/day using 8 CPUs • initialized using IC file for June 21 • Data Transfer • data provided by warehouse on 2 TB hard disk • model input files transferred to RTP using secure copy • transfer time of 1.3 MB/s from eSATA hard disk, or 9 MB/s when copied from workstation hard disk: 100 to 800 GB day. • Used previously obtained WestJump 36 km met files. • analysis performed on local workstation
Comparison with reference case • Large differences from IC at beginning of simulation
Comparison with reference case • Differences reduced but not eliminated after 13 day spinup
Ozone during SI and smog events • July 18: high ozone in urban areas or areas with precursor emissions • June 13: high ozone across large region including rural areas
Total Oxidant Total Oxidant
Aldehydes on June 13 and July 13 • July13: high aldehydes in areas with O3 precursor emissions • June 13: low aldehydes in high ozone region
Comparison of aldehydes and O3 on June 13 • Strong correlation of low aldehydes and high ozone region
Summary of First Use Test Case • Successful first test of data warehouse concept • data transfer by hard drive works well • option to download directly from the warehouse is desirable, if feasible • Suggestions for next test case: • Need datasets for the full year. • Ability to request premerged emissions files. • Separate emissions file for individual O&G projects. • Emissions projections for future years. • Distribution package should also include original modeling protocol, reports on base case MPE, emissions QA, etc.
Background O3 and Monitoring Needs • Background and transported ozone is highly variable in both space and time. • Important to accurately model background O3: • transported O3 can cause exceedances of the NAAQS. • background O3 level also affects the reactivity of a VOC-NOx mixture. • What type of monitoring network is needed to characterize background ozone? • surface monitors; lidar profiles; ozonesondes; satellite data.