Download
1 / 22
220 likes | 455 Vues
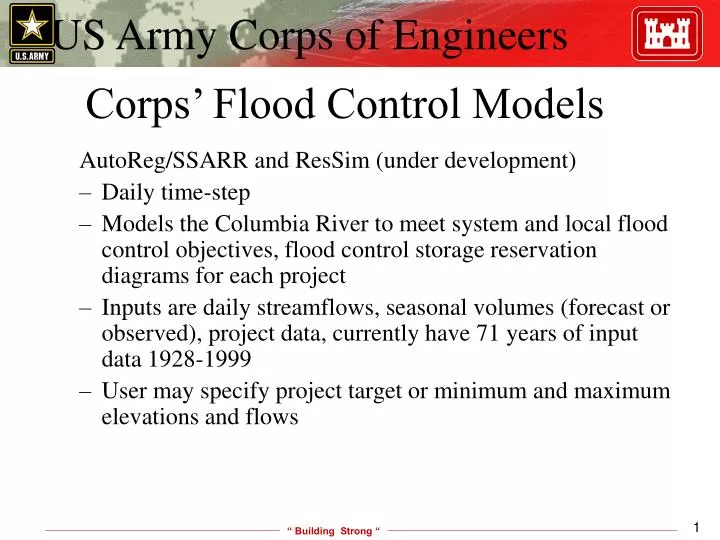
Corps’ Flood Control Models. AutoReg/SSARR and ResSim (under development) Daily time-step Models the Columbia River to meet system and local flood control objectives, flood control storage reservation diagrams for each project

E N D
Corps’ Flood Control Models AutoReg/SSARR and ResSim (under development) • Daily time-step • Models the Columbia River to meet system and local flood control objectives, flood control storage reservation diagrams for each project • Inputs are daily streamflows, seasonal volumes (forecast or observed), project data, currently have 71 years of input data 1928-1999 • User may specify project target or minimum and maximum elevations and flows
Corps’ Flood Control Models (cont.) • Model covers tributaries and mainstem Columbia River from Mica through Bonneville and Snake River from Brownlee to the confluence with the Columbia, and Dworshak on the Clearwater River. • Major flood control projects included are Mica, Duncan, Arrow, Libby, Hungry Horse, Grand Coulee, Dworshak, Brownlee and John Day • Outputs are end-of-month flood control curves (upper reservoir limits) to be used in operational planning models and real-time regulations
Corps’ Power Model • Hydro System Seasonal Regulation (HYSSR) • Monthly time-step (except includes split months for Apr and Aug) • 71-year period of record of data input • Inputs are power rule curves, flood control rule curves, project operating constraints, plant data, fisheries objectives (flow augmentation and spill), month-average unregulated inflows, seasonal volumes (forecast or observed), hydropower loads • Model covers tributaries and mainstem Columbia River from Mica through Bonneville, Snake River from Brownlee to the confluence with the Columbia, and Dworshak on the Clearwater River. • Main outputs are system and project and system monthly power generation, project outflows, end-of-month reservoir elevations • Output used for Pacific Northwest Coordination Agreement and Columbia River Treaty planning operations
Flood Control Storage Space Requirements • Storage Reservoir Diagrams • Seasonal Water Supply forecasts • Runoff shape and Refill • Flood Control Curves with Seasonal Volume Forecasts from Climate Change
Storage Reservation Diagram (SRD) • SRDs define the end-of-month flood control space requirements, or upper limits to which the reservoir should be operated • Reservoirs draft in the winter and early spring to make space for snowmelt • Reservoirs refill by end of June – July • Reservoir space requirements are variable depending upon seasonal runoff volume forecasts • SRDs exist for Mica, Arrow, Duncan, Libby, Grand Coulee, Hungry Horse, Dworshak, and Brownlee
Evacuation Refill Hold
Seasonal Water Supply Forecasts Water Supply Forecasts are computed once a month and used to determine flood control space requirements
Evacuation Period • The evacuation period varies depending on project, but may begin as early as October and end as late as April 30 • Fall flood control space requirement is a fixed amount to provide reservoir regulation capability for rainfall events • Evacuation for the spring freshet for a given project is based on a water supply forecast and a project’s SRD.
Holding Period • When projects have evacuated to their full evacuation point, they may hold pool and pass inflow until refill is triggered. • Holding pool may not be possible if the inflows are less than required minimum flows • Full evacuation may occur as early as the end of February (Duncan) or as late as April 30 (Grand Coulee).
Runoff Shape • Runoff shape is flow versus time and may be peaked or broad • Greatly impacts when reservoirs can begin refill, and how fast they can refill • Runoff may begin in early or late spring. Generally, on average it begins about the first week in May
Refill Trigger • Runoff begins on the date that the forecasted unregulated flow at The Dalles reaches a computed flow called the “Initial Controlled Flow”, or ICF • Conceptually, the ICF is a volume converted to a flow rate and is a water balance reflecting reservoir space to refill and the seasonal volume to run off.
ICF Concept Volume to store ICF Date Volume to pass ICF
Refill • Headwater projects refill by reducing outflows to minimum flow • Local flood control objectives are always taken into consideration. • Grand Coulee and Arrow are used together to control flow at The Dalles.
Refill (cont.) • NWRFC forecasts all streamflows in the Columbia Basin • The controlled flow may be adjusted upwards to reduce the risk of uncontrolled flows if the projects are filling too fast because the volume forecast is increasing, or the runoff shape is highly peaked • The controlled flow may be adjusted downwards if the volume forecast significantly decreases, there appears to be a low risk of exceeding the controlled flow, or if refill is at risk
Compute Flood Control Curves with Seasonal Volume Forecasts from Climate Change • First step- compute flood control curves with climate change seasonal volume forecasts for the existing seasonal volume forecast periods using existing SRDs • Input resulting flood control curves into operational models (Demonstration Analyses)
Detailed Flood Control Curve Computations with Climate Change Seasonal Volume Forecasts • Next steps- Examine climate change hydrologic shapes, run statistics, frequency curves • Determine what seasonal volume forecast periods are needed for flood control. For example, The Dalles forecast period may need to be March-July rather than April – August • Develop new SRDs and perform refill regulations until flood risk management objectives are met (objectives not yet defined) • This effort would be quite extensive and would involve assumptions and decisions regarding operation of Canadian projects
Willamette Basin Projects • Eleven flood control storage reservoirs • Two reregulation projects • The same rule curve used in every year • Rain driven • Willamette projects not modeled in the Columbia basin flood control modeling