Download
1 / 57
580 likes | 757 Vues
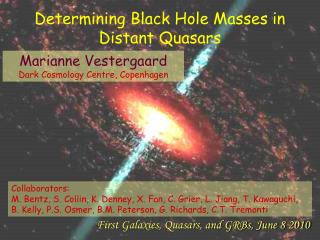
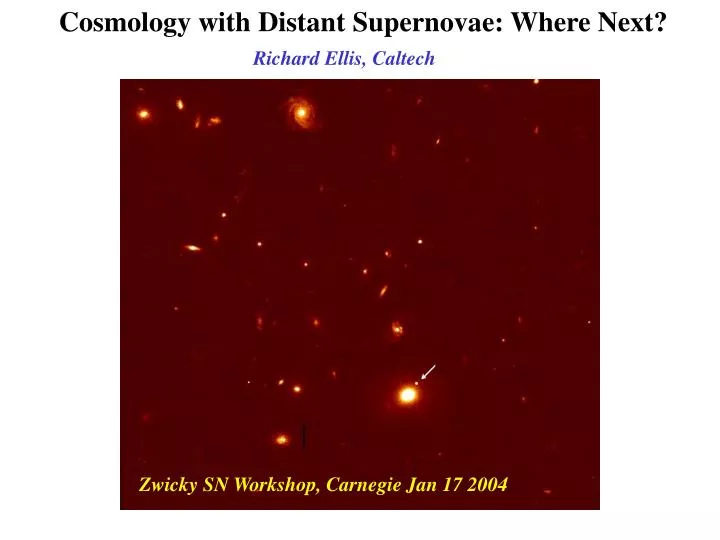
Cosmology with Distant Supernovae: Where Next?. Richard Ellis, Caltech. Zwicky SN Workshop, Carnegie Jan 17 2004. “Concordance Cosmology”: triumph or sham?. Concordance is worrying: DM 0.27 0.04 B 0.044 0.004 0.73 0.04 (Bennett et al 2003)

E N D
Cosmology with Distant Supernovae: Where Next? Richard Ellis, Caltech Zwicky SN Workshop, Carnegie Jan 17 2004
“Concordance Cosmology”: triumph or sham? • Concordance is worrying: • DM 0.27 0.04 • B 0.044 0.004 • 0.73 0.04 • (Bennett et al 2003) • All 3 ingredients comparable in magnitude but only one component physically understood! • 0: why this value and why acceleration now? 2dF
Efstathiou et al (2001)Joint analysis of CMB + 2dF data CMB alone CMB + 2dF Contrary to popular belief CMB alone does not convincingly indicate spatial flatness if is unknown CMB + 2dF confirms spatial flatness and non-zero independent of any supernova data WMAP+2dF/SDSS: Same idea, higher precision
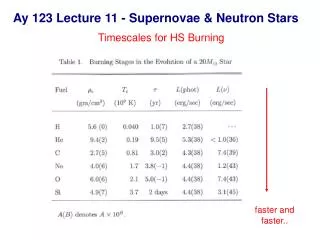
Role of SNe:Direct method for verifying cosmic acceleration Remarkable conclusions demand remarkable evidence • Where next in cosmological applications? • More of the same (Tonry et al 2003) • Better data (HST z<1, Knop et al 2003) • Higher redshift data (GOODS; Subaru) • Check systematics • Independent methods (e.g. SN II, Hamuy et al)
More of the same: HiZ team Tonry et al (2003) empty • 23 new IfA/HiZ SNe • but only 9 confirmed as Ia • 0.34 <z < 1.09 • 15 with z > 0.7 (doubling #)
Better z < 1 HST data: SCP team Knop et al Ap J 598, 102 (2003) 11 new HST SNe 0.36<z<0.86 higher quality multi-color data enabling E(B-V) measures
Probing to higher z with HST: (HDF: Gilliland et al 1999, Riess et al 2001) SN1997ff: z = 1.7 0.1 GOODS SN Ia 2002fw z=1.3 (Riess et al 2003) ACS grism 15ksec (-- SN Ia 1981b) Color discrimination of SNIa/II based on the UV deficit of Ia’s
Bias in finding bluer SNe at high z? Possible systematics in GOODs program locating SNe Ia via ACS 850LP measuring restframe B-band (and UV) with NICMOS F110W filter.
Future HST surveys (GOODS, COSMOS..) will only modestly increase z > 1 sample (20-30 events)
Investigating Systematic Effects • Differential extinction – greater amounts of dust in high z host galaxies: mimics > 0 • SN properties may depend on enviroment e.g. galaxy type or mix (Hamuy et al 1996, 2000) • Evolutionary differences e.g. progenitor composition (Höfflich et al 1999)
Evolution?Residuals from best fit to SN Hubble diagram (SCP 1999) Low z High z 1 mag Constant scatter (allowing for obs. errors) with z provides a (weak) case against evolution which would otherwise have to be well-orchestrated with cosmic time.
Reddening? E(B-V) estimates for low & high z SNe in improved HST sample Knop et al SCP 2003
Morphology? Type-dependent SN Ia light curves B-V Type m15(B) Hamuy et al AJ 120, 1479 (2000)
HST STIS Snapshot Program (Sullivan + RSE) Cycle 8+10 STIS 50CCD (unfiltered) snapshot imaging (retrospective) • host galaxy morphology • precise SN location • slit arrangement for diagnostic Keck spectroscopy STIS imaging: 59 targets 5 not observed/failed 2 no host visible 52 classified hosts (P99 42 + new) Keck ESI: 16 targets E(B-V) for 6 plus 24 low z SNe (Hamuy, Riess) Sullivan et al MN 340, 1057 (2003)
SCP Hubble Diagram by Host Galaxy Type • spheroidal •spiral • late/Irr Type N dispersion (flat) P(>0) Spheroidal 13 (15) 0.167 0.60 (0.59) 97.9 Spiral 23 (28) 0.197 0.58 (0.58) 98.6 Late/Irr 23 (26) 0.265 0.75 (0.74) 99.9 Small offset of high z spheroidals (<0.01) from adopted SCP fit
Light curve “stretch” distributions at high/low z Low z Unfortunately, the similar range in light curve “stretch” at low and high z means we cannot readily test for all possible systematic effects e.g. decline rate versus type as studied locally by Hamuy. High z
Rest-frame color excess versus type (Sullivan et al) Type E(B-V) = (B-V)obs – (B-V)0,s Little extinction in high z SNe and sensible type-dependent trends MB (rest) = MB(spheroidal) + 0.07 from Hubble diagram AV from 6 ESI spectra: 0.06-1.0 mag Lack of Irregulars in the SN-selected sample c.f. HST-based z surveys
Progenitor studies • Spectroscopic evolution of selected high z SNe c.f. improved local templates (SN Factory) • Metallicity of progenitor? detailed UV spectra near maximum light (Nugent et al 1999) • Nature of Ia progenitor: rate at as a function of z in field (Pain et al) and in clusters (Gal-Yam)
Spectral Evolution of Distant SNe Ia Q: What is the best diagnostic spectroscopic correlation that should be tested for a modest high z sample (z=0.5)
Nugent et al (1995): Spectral Sequence of SNe Ia R(Ca II) Synthetic & observed spectral sequence MB L R(Si II) blue/red Synthetic sequence reproduces trend via 7400 < Teff < 11000
R(Si II) versus v10(Si II) (Hatano et al 2000) Do SNeIa form a one parameter sequence: can we verify a sequence at high z?
UV Opacity as Probe of SNIa Metallicity (Nugent et al 1999) Strong UV dependence expected from deflagration models when metallicity is varied in outermost C+O layers (Lenz et al 2000)
UV Trends in Nearby SNe Ia (STIS, Nugent) Can we explore these trends at high z and correlate with Hubble diagram?
CFHT Legacy Survey (2003-2008) Deep Synoptic Survey Four 1 1 deg fields in ugriz 5 nights/lunation 5 months per accessible field 2000 SNe 0.3 < z < 1 Megaprime Caltech’s role Spectral follow-up of 0.4<z<0.6 SNe Ia Tests on 0.2<z<0.4 SNeII
The Need for Photometric Pre-Classification Discovery Reference Difference CFHTLS SNe Ia from Sep 2003 Nearby search • Hi-z SN spectra are much harder to take due to both their faintness & their separation from their host galaxy is comparable to the seeing. • Avoid wasting Keck time taking spectra of objects too close/wrong sub-type.
Photometric redshifts/typing for distant SNe • New code SNphot-z pre-classes type, z & epoch prior to taking spectra: only practical for the CFHTLS multi-filter rolling search • Templates from Gilliland, Nugent & Phillips (1999) updated from Nugent et al. (2002). • Calculate color evolution as a function of epoch, z, type, extinction, stretch (Ia’s) in ugriz for all targets. Spectral templates created by homogenizing IUE and HST observations + some modeling to fill in the gaps. SN Ia template weekly for the first 7 weeks.
SN Photo-Z: Results Based on 3 epochs of photometry with only R & I data.
CFHT Legacy Survey: Progress • 17 SNIa 0.25<z<0.55 to correlate spectral dispersion with Hubble diagram residuals (in progress) • 3 SNII 0.1<z<0.4 to explore feasibility of EPM/Hamuy methods
Results: I - Extending Environmental Range Ref Disc Sub Unlike previous searches the CFHTLS SN search is finding SNe with very low % increases near the cores of bright galaxies, sampling a much broader range of environments. How do they differ?
Results: II - Correlating Spectral Features The large choice of CFHTLS SNe enables us to target for comparisons at same redshifts & epochs. • Two SNe Ia near peak brightness both with z= 0.45. • Significant difference in Ca II H&K P-Cygni feature (split in 2003fh, smooth in 2003fg) • Significant UV flux differences. • Minor velocity shifts of the intermediate mass material (SiII and SII).
Results: III - Dispersion in UV properties z 0 STIS z 0.5 Keck Correlating metallicity/UV opacity with light curves is a major goal
Can Cosmic Acceleration be deduced from SN II? Hamuy & Pinto (2002) propose a new “empirical” correlation (0.2 mag, 9% in distance) between the expansion velocity at the plateau phase and bolometric luminosity for Type IIs. If vindicated with more data, the Hubble diagram of SNII will provide a completely independent check of the cosmic acceleration using Keck QUEST will locate nearby SNIIs on plateau phase; expansion velocities will come from override time on 200-inch to test this proposition
Type Ia SNE Use Rate from R. Pain, et al. (APJ 577, 120, 2002) Type II SNE Typically 2 mags fainter than Ia’s (Hamuy & Pinto APJ 566, L63, 2002) About twice as numerous per unit volume as Ia’s (Capellaro, et al., AA 351, 459, 1999) Estimate numbers of SNe’s for 1000 square degrees, 15 daytime window Expected Numbers of Supernovae Type Ia SNe’s Type II SNe’s
Keck example: SN2001kf z=0.21 SNIIp (V=23.0) Measuring the Fe II expansion is feasible at z 0.3 in 2-3 hours 10-20 SNeIIp free from systematics would confirm 0 at 3
Conclusions • • Distant SN programs are entering new, more detailed phases utilising HST and high s/n spectroscopy to provide increased astrophysical data for each event • global constraints on evolution & progenitor details. (exciting outcome whether acceleration supported or not) • • First enhanced datasets tend to support the SCP conclusions (SN in field spheroidals confirm 0.7 ) • CFHTLS will extend these SN Ia studies via spectral sequences based on metallicities/environment • Palomar/QUEST2 will verify the utility of SNe II as cosmic probes: Keck may verify the acceleration! • • SNAP/JDEM represents the logical endpoint of the program
Optical ( 36 CCD’s) = 0.34 sq. deg. 4 filters on each 10.5mmpixel CCD IR (36 HgCdTe’s) = 0.34 sq. deg. 1 filter on each 18mmpixel HgCdTe SNAP/JDEM – combines SNe Ia and weak lensing as a unique probe of dark energy It should be called the Zwicky telescope! http://snap.lbl.gov
Conclusions not significantly affected by stretch corrections
Distant SNeIa have similar spectra to local counterparts at same epoch
The current situation – all literature data Tonry et al (2003)
Reddening? SCP (1999): Intrinsic reddening determined from multicolor light curves: • insufficient precision for use on individual SN by SN basis, • zero point uncertain Provides case against overall relative reddening of high c.f. low z sample
Grey dust? E(B-R)/B Grain size (m) Aguirre Ap J 525, 583 (2000): Grey dust requires larger grains with high metal content and may conflict with far IR background
Keck ESI Spectroscopic Program Keck II Echellette Spectroscopic Imager: R 25000 0.3-1m long slit • emission line properties of host galaxy (correlation with HST morphology) • reddening estimate from H/H • variance in above from longslit data in good seeing
Host Galaxy Types Classification of P99 sample of 42 into 3 broad types spheroidal/ intermediate/ late from: • ESI (+LRIS) spectrum • HST STIS image • R-I color R-I z
Type versus stretch Stretch versus radius