Download
1 / 19
190 likes | 262 Vues
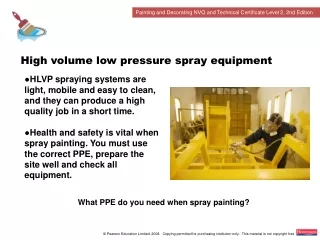
Low Flow Pre-Rinse Spray Valves. Deemed Energy Savings for Seattle City Light and the Region Regional Technical Forum April 7, 2009. Goals. Determine deemed value(s) for SCL’s program Federal Minimum as baseline Existing valve as baseline? Determine deemed value(s) for the Region

E N D
Low Flow Pre-Rinse Spray Valves Deemed Energy Savings for Seattle City Light and the Region Regional Technical Forum April 7, 2009
Goals • Determine deemed value(s) for SCL’s program • Federal Minimum as baseline • Existing valve as baseline? • Determine deemed value(s) for the Region • Federal minimum as baseline
Basic Energy Savings Variables • Incoming water temperature • Assumed 58°F for Region, 55°F for Seattle • Point of use water temperature • Pre- and post-flow rate • Pre- and post-hours of use per day • Facility operation days per year • Assumed 350 days/year (360 for groceries)
Point of Use Water Temperature Average = 98.6 deg F From Seattle City Light’s 2004 program
Point of Use Water Temp (cont) “Pre-Rinse Spray Valve Programs: How Are They Really Doing?”, SBW Consulting and Koeller & Co. for AWWA, Jul 2006
Pre- and Post-Flow Rate “Pre-Rinse Spray Valve Programs: How Are They Really Doing?”, SBW Consulting and Koeller & Co. for AWWA, Jul 2006
Pre- and Post-Flow Rate (cont) Average = 1.18gpm
Pre- and Post-Flow Rate (cont) Average = 1.68 gpm Gallons per minute
Pre- and Post-Hours of Use per Day (cont) Note: CA Phase 1 facility type breakdown was not available, so sample size and hrs/day by facility type for CA Phase 1 are based on the CA Phase 1 total values (18 and 1.27) and weighted based on the other four studies.
Pre- and Post-Hours of Use per Day (cont): Is there a reasonable way to disaggregate “restaurants”?
Deemed Savings Options & Issues Facility Type • Option 1: Deem one average energy saving for all facility types • Issue: Need to predict mix of facility type • Option 2: Deem average energy savings by facility type (Restaurant, Grocery, Institutional, Other) • Issue: More difficult program design, operation, & verification • Option 3: Provide deemed savings for both options 1 and 2 • Issue: If ability to choose the higher value on a case-by-case basis is allowed, savings would be overstated; confusion about which to use Baseline Flow Rate, Measure Life • Option A: Assume baseline is fed min standard, measure life is 4 years. • Issue: Not claiming entire savings where a PRSV was replaced early • Option B: Assume baseline is existing valve, measure life is partly 4 years (fed min gpm to 0.65 gpm), and partly 2 years (existing valve gpm to fed min gpm) • Issue: Works only for early replacement type programs; we don’t know the measure life with any certainty; the baseline existing valve will change with time as valves are naturally replaced with fed min valves • Option C: Provide deemed savings for options A and B • Issue: Confusion about which to use
Potential Solution to Option 1’s Issue “Pre-Rinse Spray Valve Programs: How Are They Really Doing?”, SBW Consulting and Koeller & Co. for AWWA, Jul 2006
Results - RegionwideFed Min Baseline (Option 3A) Note: Water/Sewer kWh savings are not shown here, but are represented in B/C ratio
Results – Seattle City LightFed Min Baseline (Option 3A) Note: Water/Sewer kWh savings are not shown here, but are represented in B/C ratio
Results – Seattle City LightExisting Baseline (Option 3B) Note: Water/Sewer kWh savings are not shown here, but are represented in B/C ratio; Analysis includes 1.68 to 1.18 gpm savings for years 1 and 2; and 1.18 to 0.65 gpm savings for years 1 through 4. Savings shown here are the average annual savings over the 4-year measure life.