Download
1 / 23
230 likes | 398 Vues
Combining severity scores and organ dysfunction models improves the accuracy of prediction. JF Timsit, MD Réanimation médicale et infectieuse Hôpital Bichat, Paris. Slides available on http://www.outcomerea.org. Combining Organ dysfonction and severity scores. Is stupid (multicolinearity)

E N D
Combining severity scores and organ dysfunction models improves the accuracy of prediction JF Timsit, MD Réanimation médicale et infectieuse Hôpital Bichat, Paris Slides available on http://www.outcomerea.org
Combining Organ dysfonction and severity scores • Is stupid (multicolinearity) • However the colinearity is not so important • It works : TRIO score
Using 2 scores…. Selection of variables is based on data reduction principle • Simple • Numerically stable, easily generalized • Overfitting phenomenon: • The estimates become unstable • Large SD of the beta estimates • Insufficient fit • Low applicability in an external data set • The mechanical selection is not sufficient…
Combining Organ dysfonction and severity scores • Is stupid (multicolinearity) • However the colinearity is not so important • We have already the data collected • It works : TRIO score
Because variables enclosed in these composite scores are different SAPSII X X X X X X X X X X X X X X X LOD X X X X X X X X X X X X SOFA X X X X X X X X X X X Age Type of adm. Chronic HS MV Vasopressors Temp K, NA, CO3H- Pao2/fiO2 HR BP WBC Platelets PTT Bilirubin Urea Creatinine Urine output GCS
Because cutpoints are different • Optimized cutpoint for a particular continuous variable depend to the distribution of the variable in the training set • Then: • If various cutpoints of a prognostic variable are tested, it influenced the other independent variables selected in the final model. • The same biological parameter transformed as 2 dummy variables with different cutpoints and weights could be partly non colinear Buettner et al – J Clin Epidemiol 1997; 1201
Glasgow coma score Point and cutpoints of Glagow coma scale in various scores
Neurologic dysfonction Mean(SD) 1.2 (1.9) 1.2 (1.6) 1.3 (1.6) Kendall’s W (agreement) 0.005 NS LOD SOFA MODS Maximum score= score of the highest values for neurologic dysfn Petilla et al – CCM 2002; 30: 1705-1711
Because none of the scores are sufficiently accurate • Calibration and discrimination properties varies from excellent to very poor • Different according to • Definitions of variables • Percentage of death • Countries • Acute Diagnosis,case mix • Quality of care… • Inter-observer variability (Kappa<0.9)
Discrepancies between predicted probabilities Lemeshow, Intensive care Med 1995; 21:770 Mean dif: 1% SD: 17% Predicted prob: Dif: 10-20%: 19% pts Dif>20%: 19.8% pts
Discrepancies between predicted probabilities Arabi et al –Crit Care 2002; 6:166 969 Pts/ 1 center Rsquare MPM II0 MPM II 24 APACHE II SAPS II MPM II0 1 MPM II 24 0.67 1 APACHE II 0.48 0.56 1 SAPS II 0.52 0.62 0.66 1
Because no interaction are taken into account • ODIN model: two-way interaction tested • Fagon et al – ICM 1993; 19:137 • MODS: Not reported • Marshall et al CCM 1995; 23:1638 • SOFA: Not reported (validation) but suggested • Vincent et al – CCM 1998; 26:1793 • LOD: Not reported • Le Gall et al – JAMA 1996; 276:802 • APACHE II: Not reported • Knaus et al – CCM 1985; 13:818 • SAPS II: Not reported • Le Gall et al – JAMA 1993; 270: 2957
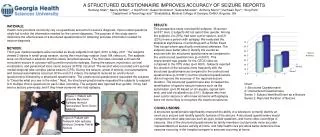
Because no interaction are taken into account SOFA score : Organ component > 3 Vincent et al – CCM 1998; 26:1793 Resp hemato liverCardiov Neuro Renal 20.7%16.7%14.3%27.9%24%23% Hemato 60.3%59%55.4%48.1%57.4% Liver 65.6%69.2%73.8%72.3% Cardio-v71.2%67.6%73.8% Neuro64.7%74.3% Renal66.7% No interaction 43.7%
Because no interaction are taken into account • In the SOFA and LOD scores organ components are assuming to be independent: • OUTCOMEREA database Associations among involvements of the six organ systems.(Kendall's b correlation coefficient ) • SOFA: Strong positive correlations between Day0 and Day7 except for pulmonary versus liver dysfunction and for pulmonary versus hematological dysfunction on days 1, 2, and 4. • LOD: Strong positive correlation between Day0 and Day 5 Timsit et al – CCM 2002: 30: 2003-2013
Combining Organ dysfonction and severity scores • Is stupid (multicolinearity) • However the colinearity is not so important • Severity scores are mandatory (ressource allocation) and organ dysfunction score is useful • It works : TRIO score
SOFA score: initial and delta score Mortality (%) Initial SOFA score Vincent JL et al – JAMA 2001; 286:1754
Combining Organ dysfonction and severity scores • Is stupid (multicolinearity) • However the colinearity is not so important • If daily scores are important initial value is important • It works
Outcomerea database • Daily clinical and biological data (multicenter french database) • Day 1 (n=1673 pts) • APACHE 2 p<0.0001 • SOFA p=0.0003 AUCROC:0.78, HLstat:=0.39 • Day 2 (n=1571 pts) • APACHE 2 p<0.0001 • SOFA p<0.0001 AUCROC:0.78, HLstat:=0.57 • Day 3 (n=1336 pts) • APÄCHE 2 p<0.0001 • SOFA p<0.0001 AUCROC:0.8, HLstat:=0.18 • Day 7 (n=700 pts) • APACHE 2 p<0.0001 • SOFA p<0.0001 AUCROC:0.8, HLstat:=0.12
Outcomerea database • Daily clinical and biological data (multicenter french database) • Day 1 (n=1673 pts) • SAPS 2 p<0.0001 • LOD p=0.001 AUCROC:0.77, HLstat:=0.26 • Day 2 (n=1571 pts) • SAPS 2 p<0.0001 • LOD p=0.0002 AUCROC:0.78, HLstat:=0.15 • Day 3 (n=1336 pts) • SAPS 2 p<0.0001 • LOD p=0.0003 AUCROC:0.79, HLstat:=0.83 • Day 7 (n=700 pts) • SAPS 2 p<0.0001 • LOD p=0.01 AUCROC:0.77, HLstat:=0.76 …even when the scores have been built in the same database
European sepsis database • 8353 patients, trained data collector + audit… • Correlation between LOD and SAPSII scores: • R2=0.711 • Multiple logistic regression Parameter DF Estimate S. Error Chi-Square Pr > ChiSq Intercept 1 -3.7006 0.0888 1738.4827 <.0001 SAPS 1 0.0534 0.00319 280.1879 <.0001 LOD 1 0.0933 0.0152 37.5703 <.0001 Special thanks to Corinne Alberti
TRIO score Rationale: To develop a score adapted to patients exposed to N.I. (hospitalized more than 72 hours) Easy to collect, reproducible 893 Pts (268 Hosp. deaths) Outcomerea database, Timsit et al, ICM 2001;27:1012
Accuracy of SAPS, LOD MPM 72 and TRIO score External validation: 24 ICUs France Outcomerea database, Timsit et al, ICM 2001;27:1012
Conclusion • Combining Organ dysfonction and severity scores • If both scores are routinely measured • Even non logical • It could be considered as an alternative to a new severity score (easiness of record, habits, reproducibility) • In particular subsamples • Awaiting new scores…. Slides available on http://www.outcomerea.org