Download
1 / 1
10 likes | 155 Vues
The Pattern Speeds of M100 (NGC 4321) from its H a 2D Velocity Field Using the Tremaine-Weinberg Method. O. Hernandez 1,2 , P. Amram 1 , C. Carignan 2 , L. Chemin 2,3 , O. Daigle 2 , H. Wozniak 1.

E N D
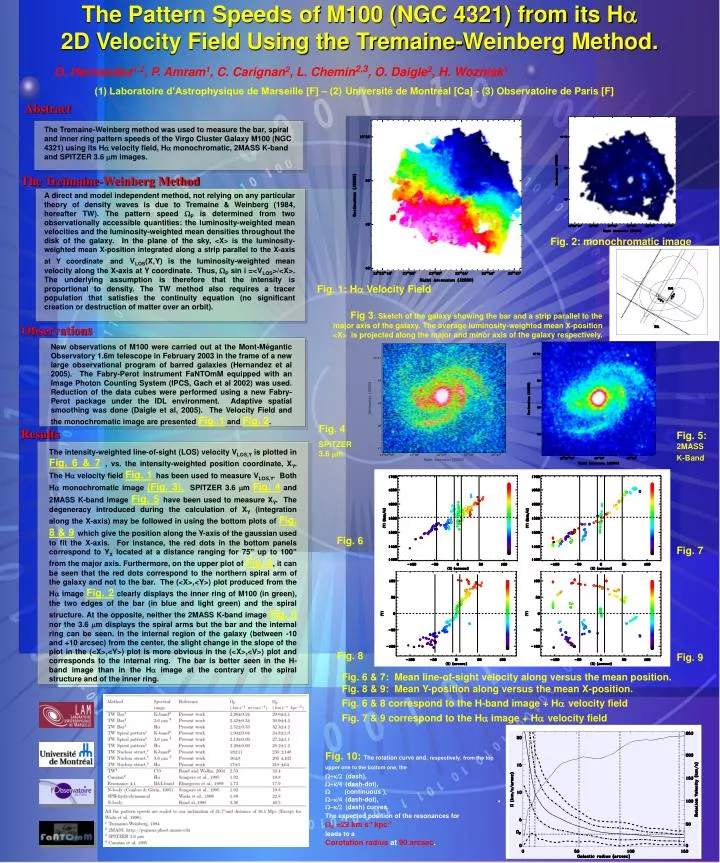
The Pattern Speeds of M100 (NGC 4321) from its Ha 2D Velocity Field Using the Tremaine-Weinberg Method. O. Hernandez1,2, P. Amram1, C. Carignan2, L. Chemin2,3, O. Daigle2, H. Wozniak1 (1) Laboratoire d’Astrophysique de Marseille [F] – (2)Université de Montréal [Ca] - (3) Observatoire de Paris [F] Abstract The Tremaine-Weinberg method was used to measure the bar, spiral and inner ring pattern speeds of the Virgo Cluster Galaxy M100 (NGC 4321) using its Ha velocity field, Ha monochromatic, 2MASS K-band and SPITZER 3.6 mm images. The Treimaine-Weinberg Method A direct and model independent method, not relying on any particular theory of density waves is due to Tremaine & Weinberg (1984, hereafter TW). The pattern speed WP is determined from two observationally accessible quantities: the luminosity-weighted mean velocities and the luminosity-weighted mean densities throughout the disk of the galaxy. In the plane of the sky, <X> is the luminosity-weighted mean X-position integrated along a strip parallel to the X-axis at Y coordinateandVLOS(X,Y) is the luminosity-weighted mean velocity along the X-axis at Y coordinate. Thus, WP sin i =<VLOS>/<X>. The underlying assumption is therefore that the intensity is proportional to density. The TW method also requires a tracer population that satisfies the continuity equation (no significant creation or destruction of matter over an orbit). Fig. 2: monochromatic image Fig. 1: Ha Velocity Field Fig 3: Sketch of the galaxy showing the bar and a strip parallel to the major axis of the galaxy. The average luminosity-weighted mean X-position <X> is projected along the major and minor axis of the galaxy respectively. Observations New observations of M100 were carried out at the Mont-Mégantic Observatory 1.6m telescope in February 2003 in the frame of a new large observational program of barred galaxies (Hernandez et al 2005). The Fabry-Perot instrument FaNTOmM equipped with an Image Photon Counting System (IPCS, Gach et al 2002) was used. Reduction of the data cubes were performed using a new Fabry-Perot package under the IDL environment. Adaptive spatial smoothing was done (Daigle et al, 2005). The Velocity Field and the monochromatic image are presented Fig. 1 and Fig. 2. Fig. 4 SPITZER 3.6 mm Results Fig. 5: 2MASS K-Band The intensity-weighted line-of-sight (LOS) velocity VLOS,Y is plotted in Fig. 6 & 7, vs. the intensity-weighted position coordinate, XY. The Ha velocity field Fig. 1has been used to measure VLOS,Y. Both Ha monochromatic image (Fig. 3), SPITZER 3.6 mm Fig. 4 and 2MASS K-band image Fig. 5have been used to measure XY. The degeneracy introduced during the calculation of XY (integration along the X-axis) may be followed in using the bottom plots of Fig. 8 & 9which give the position along the Y-axis of the gaussian used to fit the X-axis. For instance, the red dots in the bottom panels correspond to YX located at a distance ranging for 75” up to 100” from the major axis. Furthermore, on the upper plot of Fig. 6, it can be seen that the red dots correspond to the northern spiral arm of the galaxy and not to the bar. The (<X>,<Y>) plot produced from the Ha image Fig. 2 clearly displays the inner ring of M100 (in green), the two edges of the bar (in blue and light green) and the spiral structure. At the opposite, neither the 2MASS K-band image Fig. 5 nor the 3.6 mm displays the spiral arms but the bar and the internal ring can be seen. In the internal region of the galaxy (between -10 and +10 arcsec) from the center, the slight change in the slope of the plot in the (<X>,<Y>) plot is more obvious in the (<X>,<V>) plot and corresponds to the internal ring. The bar is better seen in the H-band image than in the Ha image at the contrary of the spiral structure and of the inner ring. Fig. 6 Fig. 7 Fig. 8 Fig. 9 Fig. 6 & 7: Mean line-of-sight velocity along versus the mean position. Fig. 8 & 9: Mean Y-position along versus the mean X-position. Fig. 6 & 8 correspond to the H-band image + Havelocity field Fig. 7 & 9 correspond to the Ha image + Havelocity field Fig. 10: The rotation curve and,respectively,from the top upper one to the bottom one, the W+k/2 (dash), W+k/4 (dash-dot), W (continuous ), W-k/4 (dash-dot), W-k/2 (dash) curves. The expected position of the resonances for WP =29 km s-1 kpc-1 leads to a Corotation radius at 90 arcsec.