Download
1 / 47
500 likes | 828 Vues
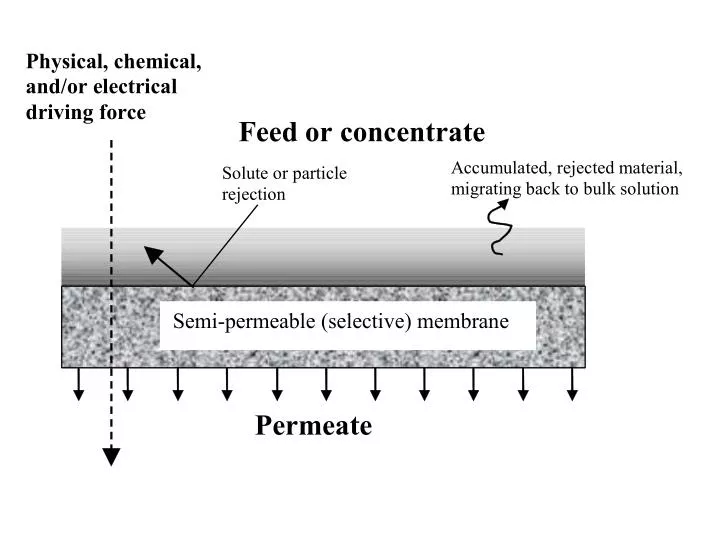
c p ( x ). Permeate ( Q p , c p , out ). Feed ( Q f , c f ). c c ( x ). Concentrate ( Q c , c c , out ), Retentate, Rejectate. Membrane Applications in Drinking Water Treatment. Pressure-Driven Membrane Processes. Separate by size and chemistry Concentration, Porosity Effects.

E N D
cp(x) Permeate(Qp, cp,out) Feed(Qf, cf) cc(x) Concentrate (Qc, cc,out), Retentate, Rejectate
Pressure-Driven Membrane Processes • Separate by size and chemistry • Concentration, Porosity Effects
OTHER DRIVING FORCES • Charge Gradient (Electrodialysis) • Concentration Gradient (Dialysis) • Temperature Gradient (Thermoosmosis)
PRESSURE GRADIENT PORE DIAMETER REMOVAL EFFICIENCY MEMBRANE DESIGNATION
Membrane Separations for Application to Drinking Water Treatment Macro Micro Ionic Range Molecular Range MacroParticleRange Molecular Range ParticleRange Size, Microns 0.001 (nanometer) 0.01 100 1000 0.1 10 1.0 Molecular Weight (approx..) 100 100,000 500,000 1,000 Viruses Dissolved Salts (ions) Bacteria Relative Sizes Algae Organics (e.g., Color , NOM, SOCs) Cysts Sand Clays Silt Asbestos Fibers Reverse Osmosis Ultrafiltration Separation Conventional Filtration (granular media) Microfiltration Process Nano filtration
1 mm The Two Meanings of Filtration:2. Porous Membrane Filtration
40% PDMAEMA-60% PFOMA Thin-film Composite NF Membrane (Polysulfone Support Layer)
Membrane Geometry Hollow Fibers MF/UF Spiral Wound NF/RO
INORGANIC SYNTHETICS Ceramics Glass Metallic • Excellent thermal stability • Withstands chemical attack
Two MF/UF Configurations • Encasedmembrane system • Submerged membrane system Filtrate Membrane Pressure Vessel(s) FeedWater Pump Pump supplies positive pressure to PUSH water through membrane media. FeedWater Membrane Filtrate Open Tank Pump Pump suction PULLS water through membrane media.
Raw Water Pump Permeate 2-12 psi HF Wasting Air Immersed Membranes with Gentle Crossflow
CASCADE SYSTEM FEED PERMEATE RETENTATE
A Qf QP FEED PERMEATE Cf CP QR RETENTATE CR TMP = “Transmembrane pressure (difference)” Flux (“LMH” or “GFD”) = Qp / A (Contaminant) Rejection (%) = 1 -Cp/Cf Recovery (%) = Qp/Qf
(a) Defined as the ratio of permeate flow rate to feed flow rate
Example. What height would a column of water have to be to exert a pressure equal to 15 kPa? 4500 kPa? Solution. From fluid mechanics: Therefore:
Example. What is the average velocity of solution toward a membrane, if the flux is 50 LMH?
Flow Through Porous Membranes Darcy-Weisbach Eqn: For Laminar Flow: For Steady Flow Through a Pore: Hagen-Poiseuille Eqn:
Flow Through Porous Membranes Resistance (kg/m2-s): Membrane Resistance (m-1):
Flow Through Porous Membranes Resistivity: Permeability for overall flow: Permeability for individual species:
1 mm Contaminant Rejection by Open Pores (Clean Membrane)
A B Pore Membrane Contaminant Rejection by Open Pores (Clean Membrane) Increasing driving force increases flux of both water and contaminants. So, rejection of a given type of particle by a clean membrane is predicted to be independent of DP or J.
Problems Caused by NOM Membrane Fouling Interference w/Activated Carbon +Cl2 DBPs
NOM Fouling of an MF Membrane Gel Surface Gel Cross-Section Membrane Membrane support Note: <3% Removal of NOM from Feed
Heated Aluminum Oxide Particles (HAOPs) Al2(SO4)3+NaOHpH 7.0 110 oC, 24 hrs
Progressive NOM Deposition on the HAOPs Layer Vsp: 0 L/m2 1,200 L/m2 3,600 L/m2 4,700 L/m2 7,000 L/m2 7,000 L/m2
Summary: Performance and Modeling of Porous Membranes • Solution flux proportional to DP, inversely proportional to resistance • Resistance of clean membrane can be estimated from basic fluid mechanics • If contaminant rejection is primarily due to geometrical factors, it is expected to be insensitive to applied pressure and flux • In practice, resistance of accumulated rejected species quickly overwhelms that of membrane (fouling) • Frequent backwashing reduces, but does not eliminate fouling • In drinking water systems treating surface water, NOM is often a major fouling species, even though only a small fraction of the NOM is rejected • Approaches to reduce fouling by NOM and other species are the focus of active research
Transport Through Water-Selective, Dense (“Non-Porous”) Membranes cw,p Osmosis of water 55.5 cw,f 55.0 Pressure profile for P=0 everywhere cs,f 0.555 cs,p Solute, 90% rejection 0.055 With no DP, the concentration gradients drive water toward the feed and contaminants toward the permeate.
Increasing pressure increases the “effective” concentration of any species. For an increase of DP, the effective concentration is: For water: At 25oC: At DP= 3000 kPa: Result: Even a large DP increases effective concentrations by only a few percent.
The pressure required to bring the effective concentration of water up to the concentration of pure water (and thereby stop diffusion) is the osmotic pressure, p. Permeate is often approximated as pure water. In this example, p is a pressure that increases ceff by ~1%. Note that ceff of the solute also increases by ~1%. cw,p cw,eff,f Osmosis eliminated 55.5 55.5 P = p cw,f 55.0 P = 0 cs,eff,f 0.56 cs,f 0.555 cs,p Solute, 90% rejection 0.055
Applying a DP >p causes water to move in the opposite direction from passive osmosis, hence is called reverse osmosis. For P ~3000 kPa,ceffincreases by ~3%, so: cw,eff,f 56.5 cw,p Reverse osmosis 55.5 cw,f 55.0 P > p cs,eff,f 0.57 P = 0 cs,f 0.555 cs,p Solute, 90% rejection 0.055 Although increasing DP causes the same percentage increase in ceff for water and solute, it has a much bigger effect on Dceff for water than for solute.
Performance and Modeling of Dense Membranes • Water flux occurs by diffusion, and is ~proportional to DP-Dp, because changing DP has big effect on Dcw,eff • Solute flux occurs by diffusion, and is ~proportional to Dci, because changing DP has small effect on Dci,eff • Conclusion: changing DP increases water transport more than solute transport, and so increases rejection (different from porous membranes) • Fouling also occurs on dense membranes, mostly by NOM and precipitation (scaling); reduced by “anti-scalants” • Dense membranes can’t be backwashed, because required pressures would be too high; therefore, major effort is usually devoted to pre-treatment to remove foulants • Approaches to reduce fouling are the focus of active research