Download
1 / 10
110 likes | 186 Vues
Two extra components in the Brier Score Decomposition. David B. Stephenson, Caio A. S. Coelho (now at CPTEC), Ian.T. Jolliffe University of Reading, U.K. Brier score components. To calculate the components (e.g. E(o|f)): Stratify on ALL issued probability values {f} OR

E N D
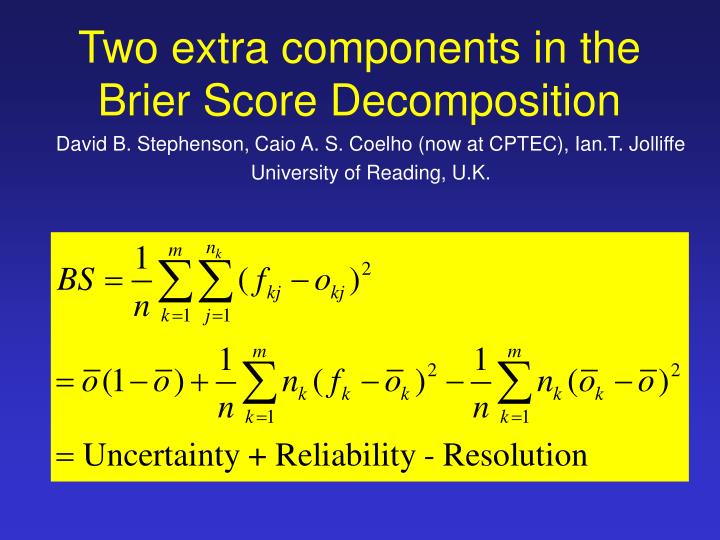
Two extra components in the Brier Score Decomposition David B. Stephenson, Caio A. S. Coelho (now at CPTEC), Ian.T. Jolliffe University of Reading, U.K.
Brier score components To calculate the components (e.g. E(o|f)): Stratify on ALL issued probability values {f} OR Stratify into m distinct probability bins: • More reliable estimates (smoothing); • Can avoid sparseness issues; • Comparison of different forecasting systems.
500 bins 100 bins 50 bins 10 bins 6 bins 8 bins Forecast system is over-confident
Example:Equatorial Pacific SST 88 seasonal probability forecasts of binary SST anomalies at 56 grid points along the equatorial Pacific. Total of 4928 forecasts. ENS OBS OBS The probability forecasts were constructed by fitting Normal distributions to the ensemble mean forecasts from the 7 DEMETER coupled models, and then calculating the area under the normal density for SST anomalies greater than zero. Forecast probabilities: f SST anomalies (°C)
Forecasts and observations at 150W X = observed binary event: =1 for above average SST Dots = ensemble mean forecasts of SST Solid line = probability forecast estimated from ensemble means
Prob. forecasts stratified on observations Forecast probability f Observed binary event X Forecast system has discrimination
Brier score for probabilties in m bins NEW!! j=1 For mathematical derivation please refer to: Stephenson, D.B., Coelho, C.A.S., and Jolliffe, I.T., 2007: Two extra components in the Brier Score decomposition, Weather and Forecasting (submitted).
Brier score components vs. num. of bins UNC REL-RES+UNC Brier Score REL - RES Brier score is less than REL-RES+UNC!
Within-bin terms and Generalised RESolution GRES=RES-WBV+WBC WBC RES -WBV GRES=RES-WBV+WBC is more constant than RES