Download
1 / 27
290 likes | 477 Vues
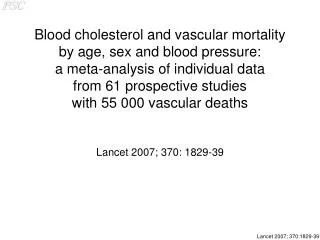
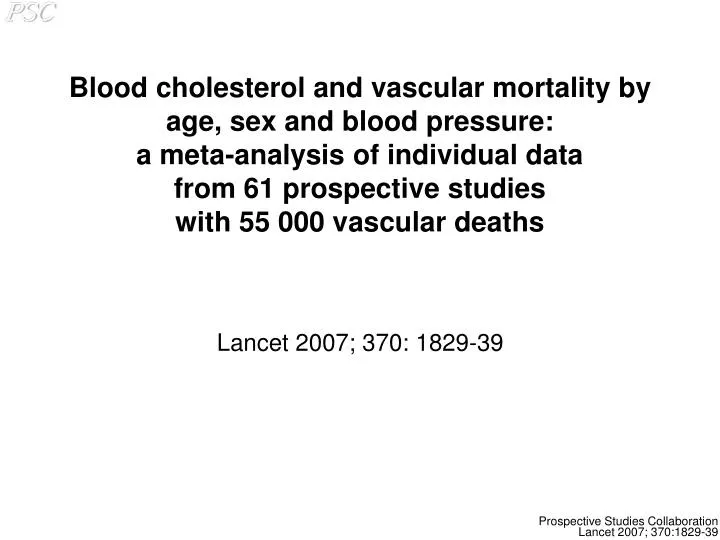
Blood cholesterol and vascular mortality by age, sex and blood pressure: a meta-analysis of individual data from 61 prospective studies with 55 000 vascular deaths. Lancet 2007; 370: 1829-39. Prospective Studies Collaboration.

E N D
Blood cholesterol and vascular mortality by age, sex and blood pressure:a meta-analysis of individual datafrom 61 prospective studieswith 55 000 vascular deaths Lancet 2007; 370: 1829-39
Prospective Studies Collaboration • Established chiefly to investigate associations of blood pressure and cholesterol with cause-specific mortality • Individual data on 900 000 participants without any previous history of vascular disease from 61 prospective cohort studies • 55 000 vascular deaths (34 000 ischaemic heart disease [IHD], 12 000 stroke, 10 000 other) • 150 000 participants from 23 studies also had HDL cholesterol (5000 vascular deaths)
Collaborators and investigators Atherosclerosis Risk in Communities (ARIC): L Chambless; Belgian Inter-university Research on Nutrition and Health (BIRNH): G De Backer, D De Bacquer, M Kornitzer; British Regional Heart Study (BRHS): P Whincup, SG Wannamethee, R Morris; British United Provident Association (BUPA):N Wald, J Morris, M Law; Busselton: M Knuiman, H Bartholomew; Caerphilly and Speedwell: G Davey Smith, P Sweetnam, P Elwood, J Yarnell; Cardiovascular Health Study (CHS): R Kronmal; CB Project: D Kromhout; Charleston: S Sutherland, J Keil; Copenhagen City Heart Study: G Jensen, P Schnohr; Evans County: C Hames (deceased), A Tyroler; Finnish Mobile Clinic Survey (FMCS): A Aromaa, P Knekt, A Reunanen; Finrisk: J Tuomilehto, P Jousilahti, E Vartiainen, P Puska; Flemish Study on Environment, Genes and Health (FLEMENGHO): T Kuznetsova, T Richart, J Staessen, L Thijs; Research Centre for Prevention and Health (Glostrup Population Studies): T Jorgensen,T Thomsen; Honolulu Heart Program: D Sharp, JD Curb; Ikawa, Noichi and Kyowa: H Iso, S Sato, A Kitamura, Y Naito; Imperial College, London and Oxon Clinical Epidemiology Limited: N Qizilbash; Centre d'Investigations Preventives et Cliniques (IPC), Paris: A Benetos, L Guize; Israeli Ischaemic Heart Disease Study: U Goldbourt; Japan Railways: M Tomita, Y Nishimoto, T Murayama; Lipid Research Clinics Follow-up Study (LRC): M Criqui, C Davis; Midspan Collaborative Study: C Hart, G Davey-Smith, D Hole, C Gillis; Minnesota Heart Health Project (MHHP) and Minnesota Heart Survey (MHS): D Jacobs, H Blackburn, R Luepker; Multiple Risk Factor Intervention Trial (MRFIT): J Neaton, L Eberly; First National Health and Nutrition Examination Survey Epidemiologic Follow-up Study (NHEFS): C Cox; NHLBI Framingham Heart Study: D Levy, R D'Agostino, H Silbershatz; Norwegian Counties Study: A Tverdal, R Selmer; Northwick Park Heart Study (NPHS): T Meade, K Garrow, J Cooper; Nurses’ Health Study: F Speizer, M Stampfer; Occupational Groups (OG), Rome: A Menotti, A Spagnolo; Ohasama: I Tsuji, Y Imai, T Ohkubo, S Hisamichi; Oslo: L Haheim, I Holme, I Hjermann, P Leren; Paris Prospective Study: P Ducimetiere, J Empana; Perth: K Jamrozik, R Broadhurst; Prospective Cardiovascular Munster Study (PROCAM): G Assmann, H Schulte; Prospective Study of Women in Gothenburg: C Bengtsson, C Björkelund, L Lissner; Puerto Rico Health Heart Program (PRHHP): P Sorlie, M Garcia-Palmieri; Rancho Bernado: E Barrett-Connor, M Criqui, R Langer; RenfrewandPaisley study: C Hart, G Davey Smith, D Hole; Saitama Cohort Study: K Nakachi, K Imai; Seven Cities China: X Fang, S Li; Seven Countries (SC) Croatia: R Buzina; SC Finland: A Nissinen; SC Greece (Greek Islands Study): C Aravanis, A Dontas, A Kafatos; SC Italy: A Menotti; SC Japan: H Adachi, H Toshima, T Imaizumi; SC Netherlands: D Kromhout; SC Serbia: S Nedeljkovic, M Ostojic; Shanghai: Z Chen; Scottish Heart Health Study (SHHS): H Tunstall-Pedoe; Shibata: T Nakayama, N Yoshiike, T Yokoyama, C Date, H Tanaka; Tecumseh: J Keller; Tromso: K Bonaa, E Arnesen; United Kingdom Heart Disease Prevention Project (UKHDPP): H Tunstall-Pedoe; US Health Professionals Follow-up Study: E Rimm; US Physicians’ Health Study: M Gaziano, JE Buring, C Hennekens; Värmland: S Törnberg, J Carstensen; Whitehall: M Shipley, D Leon, M Marmot; Clinical Trial Service Unit (CTSU): J Armitage, C Baigent, Z Chen, R Clarke, R Collins, J Emberson, J Halsey, M Landray, S Lewington, A Palmer (deceased), S Parish, R Peto, P Sherliker, G Whitlock. Steering Committee — S Lewington (coordinator and statistician), S MacMahon (chair), R Peto (statistician), A Aromaa, C Baigent, J Carstensen, Z Chen, R Clarke, R Collins, S Duffy, D Kromhout, J Neaton, N Qizilbash, A Rodgers, S Tominaga, S Törnberg, H Tunstall-Pedoe, G Whitlock.
Analysis • Cox regression adjusted for age, sex & study • Hazard ratios are presented as floating absolute risks (does not alter values but adds appropriate confidence interval to every group, including even reference group) • Adjustment for regression dilution bias makes relationship with usual values about 50% steeperthan that with measured values
IHD mortality (33 744 deaths) versus usual total cholesterol Age at risk 1 mmol/L total cholesterol 15% risk 80-89 256 128 18% risk 70-79 64 28% risk 60-69 32 42% risk 50-59 16 56% risk Hazard ratio (floating absolute risks & 95% CI) 40-49 8 4 2 1 0·5 4·0 5·0 6·0 7·0 8·0 Usual total cholesterol (mmol/L) UDV3:[VEP.PSC.FIGURES.TCHOL.240907]ihd-by-agesex-hettrend.ctrl: 24-SEP-2007 14:47:08.14
IHD mortality (33 744 deaths) versus usual total cholesterolby age and sex Age at risk Sex No. of deaths 80-89 Men 2919 Women 2707 0·85 (0·82-0·89) Total 5626 70-79 Men 7372 Women 3457 Total 10 829 0·82 (0·80-0·85) 60-69 Men 8594 Women 1825 Total 10 419 0·72 (0·69-0·74) 50-59 Men 5001 Women 560 Total 5561 0·58 (0·56-0·61) Hazard ratio (& 95% CI) 40-49 Men 1191 Women 118 Total 1309 0·44 (0·42-0·48) 0·4 0·6 0·8 1·0 Hazard ratio (& 95% CI) for 1 mmol/L lower usual total cholesterol UDV3:[VEP.PSC.FIGURES.TCHOL.240907]ihd-by-agesex-hettrend.ctrl: 24-SEP-2007 14:47:08.14
IHD mortality (33 744 deaths) versus usual total cholesterolby baseline SBP Age at risk SBP (mmHg) No. of deaths 70-89 165+ 7634 0·82 (0·79-0·84) 145-164 4645 0·79 (0·76-0·82) <145 4176 0·76 (0·73-0·79) 60-69 165+ 3174 0·81 (0·78-0·84) 145-164 3027 0·73 (0·70-0·76) <145 4218 0·68 (0·65-0·70) 40-59 165+ 1364 0·66 (0·62-0·70) 145-164 1908 0·62 (0·59-0·65) <145 3598 0·53 (0·51-0·55) 0·4 0·6 0·8 1·0 Hazard ratio (& 95% CI) for mmol/L lower usual total cholesterol UDV3:[VEP.PSC.FIGURES.TCHOL.240907]ihd-effectmod-slopes.ctrl: 24-SEP-2007 14:47:13.34
0·6 0·8 1·0 0·4 IHD mortality (33 744 deaths) versus usual total cholesterolby smoking status Age at risk Smoking status No. of deaths 70-89 2730 Current cig 0·74 (0·71-0·78) Other 11 168 0·80 (0·78-0·82) 2557 Never smoker 0·77 (0·74-0·81) 60-69 3911 Current cig 0·70 (0·68-0·73) Other 5170 0·71 (0·68-0·74) 1338 Never smoker 0·71 (0·67-0·76) 40-59 3612 Current cig 0·58 (0·56-0·60) Other 2608 0·54 (0·52-0·57) 650 0·59 (0·54-0·64) Never smoker Hazard ratio (& 95% CI) for 1 mmol/L lower usual total cholesterol UDV3:[VEP.PSC.FIGURES.TCHOL.240907]ihd-effectmod-slopes.ctrl: 24-SEP-2007 14:47:13.34
0·4 0·6 0·8 1·0 IHD mortality (33 744 deaths) versus usual total cholesterolby BMI Age at risk BMI (kg/m2) No. of deaths 70-89 30+ 2369 0·77 (0·73-0·81) 25-29 7198 0·78 (0·75-0·80) <25 6736 0·79 (0·76-0·81) 60-69 30+ 1518 0·74 (0·70-0·79) 25-29 4679 0·72 (0·69-0·74) <25 4123 0·70 (0·68-0·73) 40-59 30+ 827 0·62 (0·57-0·67) 25-29 3105 0·56 (0·54-0·59) <25 2881 0·55 (0·53-0·58) Hazard ratio (& 95% CI) for 1 mmol/L lower usual total cholesterol UDV3:[VEP.PSC.FIGURES.TCHOL.240907]ihd-effectmod-slopes.ctrl: 24-SEP-2007 14:47:13.34
IHD mortality (3020 deaths) versus usual(a) HDL cholesterol; (b) non-HDL cholesterol; and (c) total/HDL cholesterolby age at risk 1.33 units total/HDL 128 31% 70-89 years 70-89 years 64 32 70-89 years 60-69 40% 60-69 16 Hazard ratio (floating absolute risks & 95% CI) 8 40-59 44% 60-69 40-59 4 Hazard ratio (& 95% CI) Hazard ratio (& 95% CI) Hazard ratio (& 95% CI) 2 1 40-59 0·5 1·0 1·5 3 4 5 6 3 4 5 6 7 Usual HDL (mmol/L) Usual non-HDL (mmol/L) Usual total/HDL UDV3:[VEP.PSC.FIGURES.TCHOL.240907]ihd-hdletc-by-age-mg.ctrl: 24-SEP-2007 14:47:15.78
IHD mortality (3020 deaths) versus usual HDL cholesterol 128 Age at risk: 0.33 mmol/L HDL 64 70-89 35% risk 32 16 8 Hazard ratio (floating absolute risks & 95% CI) 83% risk 60-69 4 2 Hazard ratio (& 95% CI) Hazard ratio (& 95% CI) Hazard ratio (& 95% CI) 1 40-59 63% risk 0·5 1·0 1·5 Usual HDL cholesterol (mmol/L) UDV3:[VEP.PSC.FIGURES.TCHOL.240907]ihd-hdletc-by-age-mg.ctrl: 24-SEP-2007 14:47:15.78
70-89 27% risk 60-69 34% risk 40-59 43% risk IHD mortality (3020 deaths) versus usual non-HDL cholesterol Age at risk: 1 mmol/L non-HDL 128 64 32 16 8 Hazard ratio (floating absolute risks & 95% CI) 4 2 Hazard ratio (& 95% CI) Hazard ratio (& 95% CI) Hazard ratio (& 95% CI) 1 0·5 3 4 5 6 Usual non-HDL cholesterol (mmol/L) UDV3:[VEP.PSC.FIGURES.TCHOL.240907]ihd-hdletc-by-age-mg.ctrl: 24-SEP-2007 14:47:15.78
128 64 32 16 8 4 2 1 0·5 3 4 5 6 7 IHD mortality (3020 deaths) versus usual total/HDL cholesterol Age at risk 1.33 units total/HDL 70-89 31% risk 40 risk 60-69 Hazard ratio (floating absolute risks & 95% CI) 40-59 44% risk Hazard ratio (& 95% CI) Hazard ratio (& 95% CI) Hazard ratio (& 95% CI) Usual total/HDL cholesterol UDV3:[VEP.PSC.FIGURES.TCHOL.240907]ihd-hdletc-by-age-mg.ctrl: 24-SEP-2007 14:47:15.78
Stroke mortality (11 663 deaths) versus usual total cholesterol by age 64 Age at risk: HR (95% CI) per 1mmol/L : 80-89 1.06 (1.00-1.13) 32 16 70-79 1.04 (0.99-1.09) 8 Hazard ratio (floating absolute risks & 95% CI) 4 60-69 1.02 (0.97-1.08) Hazard ratio (& 95% CI) 2 40-59 0.90 (0.84-0.97) 1 4·0 5·0 6·0 7·0 8·0 Usual total cholesterol (mmol/L) UDV3:[VEP.PSC.FIGURES.TCHOL.240907]stroke-by-agecause-trend.ctrl: 24-SEP-2007 14:47:18.56
Stroke mortality (11 663 deaths) versus usual total cholesterolby type and age Stroke subtype Age at risk No. of deaths Total stroke 80-89 2632 1·06 (1·00-1·13) 70-79 4311 1·04 (0·99-1·09) 60-69 2938 1·02 (0·97-1·08) Test for trend: 12 = 9.3 (P=0.002) 40-59 1782 0·90 (0·84-0·97) Haemorrhagic stroke 80-89 422 1·06 (0·90-1·25) 70-79 915 1·18 (1·06-1·31) 60-69 743 1·09 (0·97-1·23) Test for trend: 12 = 4.3 (P=0.04) 40-59 620 0·92 (0·81-1·04) Hazard ratio (& 95% CI) Ischaemic stroke 80-89 519 1·09 (0·95-1·26) 70-79 850 1·06 (0·95-1·17) 60-69 540 0·89 (0·79-1·01) Test for trend: 12 = 15.1 (P=0.0001) 40-59 225 0·73 (0·61-0·87) 0·6 0·8 1·0 1·2 1·4 Hazard ratio (& 95% CI) for 1 mmol/L lower usual total cholesterol UDV3:[VEP.PSC.FIGURES.TCHOL.OCT07]fig4-ppt.ctrl: 17-OCT-2007 13:42:15.33
Stroke mortality (11 663 deaths) versus usual total cholesterolby baseline SBP 8 Baseline SBP (mmHg): 1 mmol/L total cholesterol 185+ 10% risk 4 Hazard ratio (floating absolute risks & 95% CI) 15% risk 165-184 2 145-164 7% risk Hazard ratio (& 95% CI) <145 42% risk 1 4·0 5·0 6·0 7·0 8·0 Usual total cholesterol (mmol/L) UDV3:[VEP.PSC.FIGURES.TCHOL.240907]STROKE-BY-SBPCAUSE-TREND.CTRL: 24-SEP-2007 14:47:21.45
Stroke mortality (16 497 deaths) versus usual total cholesterolby baseline SBP Stroke subtype SBP (mmHg) No. of deaths Total stroke 185+ 2473 1·10 (1·05-1·16) 165-184 2498 1·15 (1·09-1·20) 145-164 3092 1·07 (1·02-1·12) 125-144 2562 0·94 (0·90-0·99) Test for trend:12 = 53·2 (p<0·0001) <125 1038 0·84 (0·78-0·91) Haemorrhagic stroke 185+ 662 1·16 (1·05-1·27) 165-184 631 1·30 (1·18-1·43) 145-164 674 1·12 (1·03-1·23) 125-144 528 1·01 (0·90-1·13) <125 205 0·83 (0·71-0·98) Test for trend: 12 = 15·7 (p=0·0001) Ischaemic stroke 185+ 476 0·99 (0·89-1·11) 165-184 439 1·13 (1·01-1·26) 145-164 574 1·00 (0·91-1·11) 125-144 433 0·92 (0·82-1·03) Test for trend: 12 = 8.9 (p=0·003) <125 212 0·78 (0·67-0·90) 0·6 0·8 1·0 1·4 1·2 Hazard ratio (& 95% CI) for 1 mmol/L lower usual total cholesterol UDV3:[VEP.PSC.FIGURES.TCHOL.OCT07]fig5-ppt.CTRL: 17-OCT-2007 12:23:09.75
Stroke mortality (914 deaths) versus usual:(a) HDL cholesterol; (b) non-HDL cholesterol; and (c) total/HDL cholesterol 128 HR (95%CI) per 1.33 units total/HDL 64 32 70-89 years 70-89 70-89 years 70-89 70-89 70-89 years 0.95 (0.83-1.10) 16 8 Hazard ratio (floating absolute risks & 95% CI) 4 Hazard ratio (& 95% CI) Hazard ratio (& 95% CI) Hazard ratio (& 95% CI) 2 40-69 40-69 0.86 (0.74-0.99) 1 40-69 40-69 40-69 40-69 0·5 3 4 5 6 1·0 1·5 3 4 5 6 7 Usual non-HDL (mmol/L) Usual HDL (mmol/L) Usual total/HDL UDV3:[VEP.PSC.FIGURES.TCHOL.240907]stroke-thing4.ctrl: 24-SEP-2007 14:47:23.91
Stroke mortality (914 deaths) versus usual HDL cholesterol 128 HR (95%CI) per 0.33 mmol/L HDL 64 32 70-89 years 1.02 (0.88-1.17) 16 8 Hazard ratio (floating absolute risks & 95% CI) 4 Hazard ratio (& 95% CI) Hazard ratio (& 95% CI) Hazard ratio (& 95% CI) 2 40-69 years 1.04 (0.89-1.23) 1 0·5 1·0 1·5 Usual HDL (mmol/L) UDV3:[VEP.PSC.FIGURES.TCHOL.240907]stroke-thing4.ctrl: 24-SEP-2007 14:47:23.91
Stroke mortality (914 deaths) versus usual non-HDL cholesterol 128 HR (95%CI) per 1 mmol/L non-HDL 64 32 70-89 years 1.05 (0.91-1.20) 16 8 Hazard ratio (floating absolute risks & 95% CI) 4 Hazard ratio (& 95% CI) Hazard ratio (& 95% CI) Hazard ratio (& 95% CI) 2 40-69 years 0.96 (0.83-1.12) 1 0·5 3 4 5 6 Usual non-HDL (mmol/L) UDV3:[VEP.PSC.FIGURES.TCHOL.240907]stroke-thing4.ctrl: 24-SEP-2007 14:47:23.91
Stroke mortality (914 deaths) versus usual total/HDL cholesterol 128 HR (95%CI) per 1.33 units total/HDL 64 32 70-89 years 0.95 (0.83-1.10) 16 8 Hazard ratio (floating absolute risks & 95% CI) 4 Hazard ratio (& 95% CI) Hazard ratio (& 95% CI) Hazard ratio (& 95% CI) 2 40-69 years 0.86 (0.74-0.99) 1 0·5 3 4 5 6 7 Usual total/HDL UDV3:[VEP.PSC.FIGURES.TCHOL.240907]stroke-thing4.ctrl: 24-SEP-2007 14:47:23.91
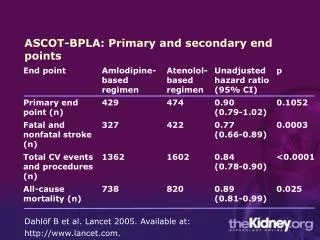
Conclusions:Total cholesterol & IHD mortality • Total cholesterol is a major risk factor for IHD both in middle and in old age • There is no threshold level of total cholesterol in the range commonly occurring in Western populations below which lower cholesterol is not associated with lower IHD mortality • There are no important sex differences in the relative effects of total cholesterol on vascular mortality • The joint relative effects of total cholesterol and blood pressure are approximately additive (rather than multiplicative)
Conclusions:HDL, non-HDL cholesterol & IHD mortality • The joint relative effects of HDL and non-HDL cholesterol are approximately independent and additive • HDL cholesterol adds worthwhile predictive information beyond either total or non-HDL cholesterol • The ratio of total/HDL cholesterol is statistically twice as informative as total cholesterol alone
Conclusions:Total cholesterol & stroke mortality • A positive relationship with ischaemic and total stroke mortality was seen only in middle age and only in those with below-average blood pressure • At older ages and, particularly, for those with systolic blood pressure over about 145 mm Hg, total cholesterol was negatively related to haemorrhagic and total stroke mortality • The contrast between these statistically reliable observational epidemiological results and the statistically reliable randomised trial results is substantial and invited further research
IHD mortality (33 744 deaths) versus usual total cholesterol by SBP Baseline SBP (mmHg): 8 185+ 165-184 145-164 4 <145 Hazard ratio (floating absolute risks & 95% CI) 2 Hazard ratio (& 95% CI) 1 4·0 5·0 6·0 7·0 8·0 Usual total cholesterol (mmol/L) UDV3:[VEP.PSC.FIGURES.TCHOL.240907]ihd-BY-SBPCAUSE-TREND.CTRL: 24-SEP-2007 14:47:42.31
IHD mortality (3020 deaths) versus:(a) usual HDL cholesterol by baseline non-HDL cholesterol(b) usual non-HDL cholesterol by baseline HDL cholesterol (a) (b) Baseline HDL (mmol/L) <1·25 <1·25 4 1·25+ 1·25+ 2 Baseline non-HDL (mmol/L) 5+ 5+ Hazard ratio (& 95% CI) Hazard ratio (& 95% CI) 1 <5 <5 0·5 1·0 1·5 3·0 4·0 5·0 6·0 Usual HDL cholesterol (mmol/L) Usual non-HDL cholesterol (mmol/L) UDV3:[VEP.PSC.FIGURES.TCHOL.240907]ihd-hdl-ndl.ctrl: 24-SEP-2007 17:19:17.65