Download
1 / 42
660 likes | 1.7k Vues
Binary Phase Diagrams. GLY 4200 Fall, 2012. Binary Diagrams. Binary diagrams have two components We therefore usually choose to plot both T (temperature) and X (composition) with pressure held constant P-X (T fixed) or P-T (X fixed) are also possible. Binary System Examples.

E N D
Binary Phase Diagrams GLY 4200 Fall, 2012
Binary Diagrams • Binary diagrams have two components • We therefore usually choose to plot both T (temperature) and X (composition) with pressure held constant • P-X (T fixed) or P-T (X fixed) are also possible
Binary System Examples • Binary solid solution - olivine, plagioclase feldspar • Binary eutectic with congruent melting - potassium feldspar - silica • Binary peritectic and eutectic with solid to solid conversion - leucite - Potassium feldspar - silica • Binary minimum melting point - potassium feldspar - albite • Binary minimum melting point with solvus - potassium feldspar - albite
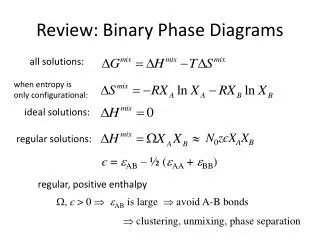
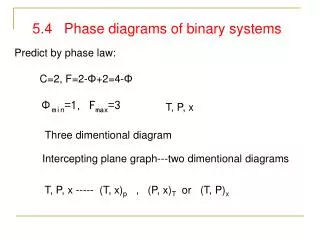
Phase Rule for Binary Systems • f = c - p + 2 = 2 - p + 2 = 4 - p • If two phases are present, there are two degrees of freedom (both T and X) • If three phases are present, there is one degree of freedom (either T or X)
Binary Solid Solution • Plagioclase Feldspar series, 39% of the earth’s crust
Phase Rule Application • How many degrees of freedom are present at points 1,2, and 3?
Binary Eutectic Diagram Conventions • Two immiscible components: such as CaAl2Si2O8 (calcic plagioclase) and FeMgSiO4 (olivine) plotted along the horizontal axis, OR olivine (isolated tetrahedra) and pyroxene (single chain tetrahedra), which are immiscible because they have different crystal structures • One variable, temperature, plotted along the vertical axis. • Pressure is held constant at 1 atmosphere. • Three phases, crystal A, crystal B, and melt. • Complete miscibility of the melt (magma)
Binary Eutectic Diagram Assumptions • The system remains in equilibrium throughout its history, so that all reactions can take place and everything can come to stability • Everything in the original melt remains in communication throughout the crystallization process
Congruent Melting • The previous case is an example of congruent melting • Congruent melting means melting of a substance directly to a liquid that is of the same composition as the solid
Incongruent Melting • Melting accompanied by decomposition or by reaction with the liquid, so that one solid phase is converted into another • Melting to give a liquid different in composition from the original solid • One example occurs in the forsterite-quartz system
Binary Eutectic with Incongruent Melting • L = Liquid • Fo is fosterite • En is enstatite • Qtz is quartz
Reaction • MgSiO3 + SiO2 = Mg2SiO4 • En + Qtz = Fo
Forsterite – Quartz at Higher T • Two liquid phases are present on the right side of the diagram
Application of Lever Rule • C = 65 weight% β
Point 2 • Solid phase B starts to form with a composition of 96 weight% β
Point 3 • C1 = 58 weight% β and C2 = 92 weight% β
Point 3 Calculations • Fraction of solid b = (65 - 58) / (92 - 58) = 20 weight% • Fraction of liquid = (92 - 65) / (92 - 58) = 80 weight%
Point 4 • C3 = 48 weight% β • C4 = 87 weight% β
Point 4 Calculations • Fraction of solid with composition C4 = (65 - 48) / (87 - 48) = 44 weight%. • Fraction of liquid at eutectic = 56 weight%
Point 5 • C5 = 9 weight% β and C6 = 91 weight% β
Point 5 Calculations • Fraction of solid with composition C6 = (65 - 9) / (91 - 9) = 68 weight% • Fraction of solid with composition C5 = (91 - 65) / (91 - 9) = 32 weight%
Effects of Pressure • With increased pressure, from 1 atm to 7 kbar, En changes from incongruent to congruent melting behavior • The field of liquid immiscibility, the 2L field on the 1 atm diagram, disappears at slightly elevated pressures and is no longer evident in the 3 kbar diagram.
Points on Diagram Edge • Points on the edge have only two components
Reading Sample Points • Note that the scales are plotted increasing in a CCW directions
Ternary Rock Composition Diagram • Ternary diagrams can be used to plot any three things
Texture Diagram • Another use of ternary diagrams
Ternary System • Sample ternary diagram
Silica 0 100 90 10 80 20 70 30 60 40 % Silica ↑ % Kalsilite ↓ 50 50 60 40 70 30 80 20 90 10 0 100 90 80 70 60 50 40 30 20 10 0 100 Nepheline Kalsilite ← % Nepheline