Download
1 / 13
140 likes | 280 Vues
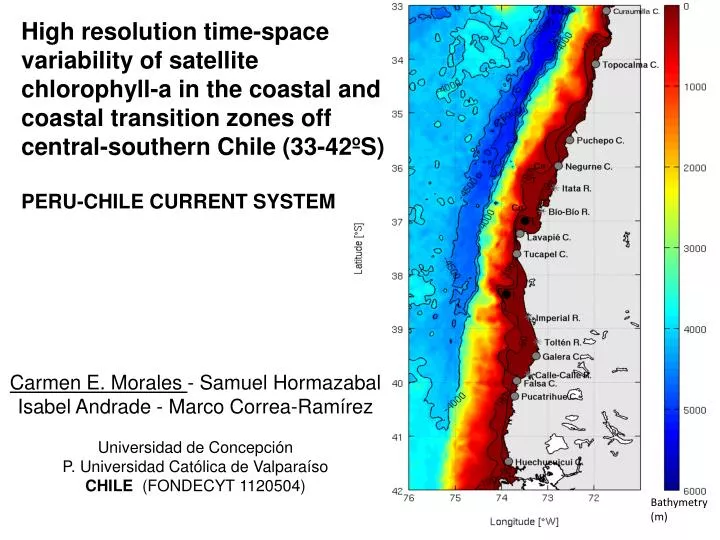
High resolution time-space variability of satellite chlorophyll-a in the coastal and coastal transition zones off central-southern Chile (33-42ºS) PERU-CHILE CURRENT SYSTEM. Carmen E. Morales - Samuel Hormazabal Isabel Andrade - Marco Correa-Ramírez Universidad de Concepción

E N D
High resolution time-space variability of satellite chlorophyll-a in the coastal and coastal transition zones off central-southern Chile (33-42ºS) PERU-CHILE CURRENT SYSTEM Carmen E. Morales - Samuel HormazabalIsabel Andrade - Marco Correa-Ramírez Universidad de Concepción P. Universidad Católica de Valparaíso CHILE (FONDECYT 1120504) Bathymetry (m)
BACKGROUND COASTAL ZONE OFF CENTRAL-SOUTHERN CHILE CHARACTERIZED BY HAVING A STRONG SEASONALITY IN WIND-DRIVEN UPWELLING PROCEESES, CHLOROPHYLL-a CONCENTRATION AND PHOTOSYNTHETIC PRIMARY PRODUCTION. • DATA SETS FOR CHLOROPHYLL-a: • IN SITU SNAPSHOTS FROM DIFFERENT STUDIES • IN SITU FIXED TIME SERIES STATION (ST. 18 OFF CONCEPCION) SINCE 2002 • REGIONAL SATELLITE TIME SERIES (100, 9, AND 4 km) NEW TOY TO PLAY WITH: HIGHER RESOLUTION SATELLITE DATA
MOTIVATION CONSIDERING A HIGHER RESOLUTION DATA, WHICH ARE THE MOST SIGNIFICANT SCALES OF TIME-SPACE VARIABILITY IN PHYTOPLANKTON BIOMASS ALONG THE COAST AND ACROSS-SHORE? * * * MEAN VALUES 2002-2012 Chl-a (mg m-3) SST (ºC) Wind stress (N m-2) wind stress curl (10-7 N m-3)
APPROACHES AND METHODS DATA - Time series satellite data: 2002-2012 Chlorophyll-a (OC3 algorithm, Werdell 2009) and SST: daily and 1X1 km resolution, MODIS Aqua mission (http://oceancolor.gsfc.nasa.gov/). Note: 5 d average and DINEOF interpolation(Alvera-Azcárateet al. 2007) Surface wind: wind stress and wind stress curl: daily and 25x25 km resolution, Cross-Calibrated Multi-Platform Surface Ocean Wind product (CCMP); (ftp://podaac-ftp.jpl.nasa.gov/allData/ccmp/L3.0/). • ANALYSIS • Multi-Taper Method - Singular Value Decomposition- (MTM-SVD)* Time-space variability of the main frequencies of Chl-a or other: • graphs of local fractional variance (LFV) and their significance • percentage of the variance explained by each frequency in different areas within the region of study (spatial reconstruction of the variance) • oscillation patterns in each frequency (phases and signal propagation) • * Correa-Ramírez & Hormazabal, 2012 (doi:103856/vol40-issue4-fulltext-19)
MAIN FREQUENCIES OF VARIABILITY OF CHL-a Dominantfrequencies of variability in Chl-a: semi-annual, annual, and inter-annual Similarities in thevariability of frequenciesbetweenthecoastal band (<100 km) and thewholeregion (coast + CTZ)
CONTRIBUTION OF THE DOMINANT FREQUENCIES OF CHL-a VARIABILITY IN THE SPACE DOMAIN INTER-ANNUAL ANNUAL SEMI-ANNUAL
ANNUAL CYCLE OF CHL-a (anomalies) WINTER SPRING SUMMER AUTUMN
MAIN FREQUENCIES OF VARIABILITY CHL-a, SST, AND WIND CoastalChl-a Coastal SST
ANNUAL CYCLE OF (anomalies) WIND STRESS (color) AND WIND STRESS CURL (grey line) WINTER SPRING SUMMER AUTUMN
PATTERNS OF CHL-a, SST, Wind VARIABILITY - COASTAL Chl-a SST Windforcing NIÑO NIÑA NIÑO NIÑA EL NIÑO 3.4
CONCLUSIONS Dominant frequency of Chl-a variability in the region: annual – associated with wind and SST variability Higher (inter-annual) and lower (semi-annual) frequencies also important but beyond the coastal band. In the coastal band, the patterns of the annual phytoplankton cycle: An alongshore propagation of the Chl-a increase a strong latitudinal zonation of the Chl-a 2 breaks in continuity (at ~37 and 40°S, two main upwelling centers). In the CTZ, the highest mean Chl-a (>0.5 mg/m3) extended out to ~200 km offshore in the northern region (33-38°S) whereas it was about half that width in the southern region (38-42°S) associated to a change in wind stress and wind stress curl.
PUZZLE Offshore annual cycle of Chl-a in opposite phase with coastal Chl-a (Yuras et al., 2005). Between the coast and the offshore, a band of ~60-80 km with no significant annual variability annual increase in Chl-a in the coastal band does not propagates to offshore waters. Implications: Chl-a increases in the CTZ depend on in situ growth of phytoplankton (no advection from coast) -- a process most likely linked to eddy pumping via mesoscale eddies. Assumption: eddy generation has no annual frequency! IS THAT TRUE ??? OTHER EXPLANATIONS?????