Download
1 / 7
80 likes | 206 Vues
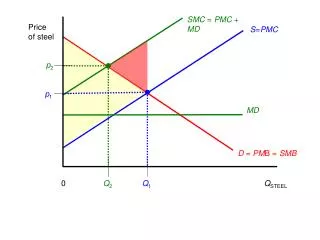
Negative Production Externalities. Figure 2. SMC = PMC + MD. Price of steel. S = PMC. The steel firm sets PMB=PMC to find its privately optimal profit maximizing output, Q 1. The yellow triangle is the consumer and producer surplus at Q 1.

E N D
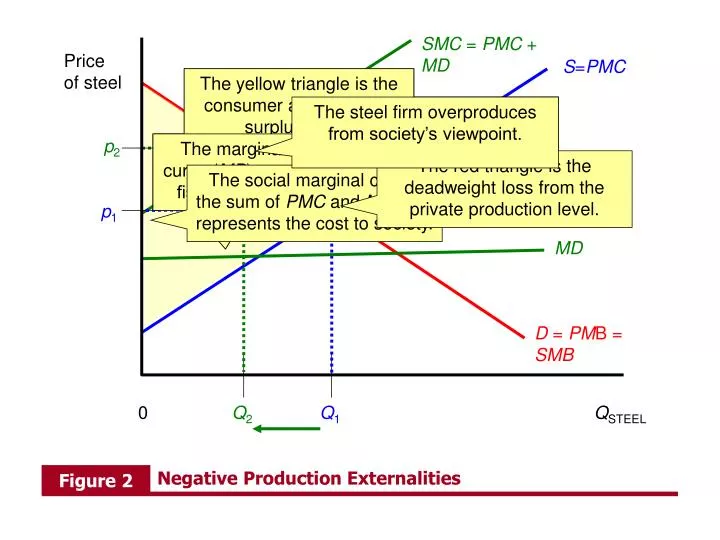
Negative Production Externalities Figure 2 SMC = PMC + MD Price of steel S=PMC The steel firm sets PMB=PMC to find its privately optimal profit maximizing output, Q1. The yellow triangle is the consumer and producer surplus at Q1. The socially optimal level of production is at Q2, the intersection of SMC and SMB. The steel firm overproduces from society’s viewpoint. p2 The marginal damage curve (MD) represents the fishery’s harm per unit. This framework does not capture the harm done to the fishery, however. The red triangle is the deadweight loss from the private production level. The social marginal cost is the sum of PMC and MD, and represents the cost to society. p1 MD D = PMB = SMB 0 Q2 Q1 QSTEEL
Negative Consumption Externalities Figure 3 Price of cigarettes S=PMC=SMC The yellow triangle is the surplus to the smokers (and producers) at Q1. The smoker sets PMB=PMC to find his privately optimal quantity of cigarettes, Q1. The MD curve represents the nonsmoker’s harm per pack of cigarettes. This framework does not capture the harm done to non-smokers, however. The social marginal benefit is the difference between PMB and MD. The red triangle is the deadweight loss from the private production level. p1 The smoker consumes too many cigarettes from society’s viewpoint. The socially optimal level of smoking is at Q2, the intersection of SMC and SMB. MD p2 D=PMB SMB=PMB-MD 0 Q2 Q1 QCIGARETTES
Negative Production Externalities and Bargaining: Giving the Fish People Property Rights Figure 5 SMC = PMC + MD Price of steel This bargaining process will continue until the socially efficient level. S = PMC The gain to society is this area, the difference between (PMB -PMC) and MD for the second unit. The gain to society is this area, the difference between (PMB -PMC) and MD for the first unit. p2 If the fishery had property rights, it would initially impose zero steel production. The reason is because any steel production makes the fishery worse off. p1 MD But there is room to bargain. The steel firm gets a lot of surplus from the first unit. Thus, it is possible for the steel firm to “bribe” the fishery in order to produce the next unit. While the fishery suffers only a modest amount of damage. While the fishery suffers the same damage as from the first unit. There is still room to bargain. The steel firm gets a bit less surplus from the second unit. Thus, it is possible for the steel firm to “bribe” the fishery in order to produce the first unit. D = PMBSMB 0 1 2 Q2 Q1 QSTEEL
Negative Production Externalities and Bargaining: Steel Producers Have Property Rights Figure 6 SMC = PMC + MD Price of steel S = PMC This bargaining process will continue until the socially efficient level. The gain to society is this area, the difference between MD and (PMB -PMC) by cutting another unit. The gain to society is this area, the difference between MD and (PMB-PMC) by cutting back 1 unit. If the steel firm had property rights, it would initially choose Q1. This level of production maximizes the consumer and producer surplus. While the steel firm suffers a larger loss in profits. While the steel firm suffers only a modest loss in profits. p2 p1 MD Thus, it is possible for the fishery to “bribe” the steel firm to cut back another unit. The fishery gets the same surplus as cutting back from the first unit. The fishery gets a lot of surplus from cutting back steel production by one unit. Thus, it is possible for the fishery to “bribe” the steel firm to cut back. D=PMB=SMB 0 Q2 Q1 QSTEEL
Corrective (“Pigouvian”) Taxation Figure 7 SMC=PMC+MD S=PMC+tax Price of steel S=PMC The socially optimal level of production, Q2, then maximizes profits. p2 The steel firm initially produces at Q1, the intersection of PMC and PMB. Imposing a tax shifts the PMC curve upward and reduces steel production. Imposing a tax equal to the MD shifts the PMC curve such that it equals SMC. p1 D = PMB = SMB 0 Q2 Q1 QSTEEL
Quantity Regulation Figure 9 SMC = PMC + MD Price of steel S = PMC p2 The firm has an incentive to produce Q1. Yet the government could simply require it to produce no more than Q2. p1 D = PMB = SMB 0 Q2 QSTEEL Q1
Table 2 The U.S. is currently responsible for nearly 25% of the planet’s carbon dioxide emissions. Developing counties like China and India emit large quantities of greenhouse gasses. Japan contributes only 5% of annual emissions.