Download
1 / 3
30 likes | 119 Vues
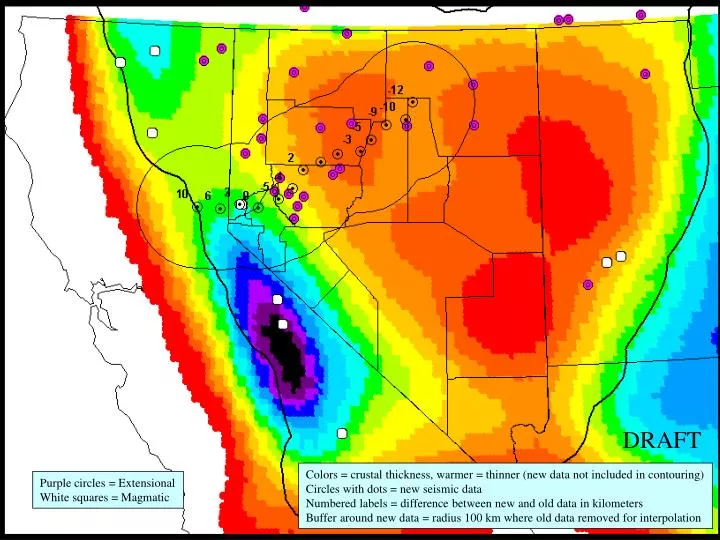
DRAFT. Colors = crustal thickness, warmer = thinner (new data not included in contouring) Circles with dots = new seismic data Numbered labels = difference between new and old data in kilometers Buffer around new data = radius 100 km where old data removed for interpolation.

E N D
DRAFT Colors = crustal thickness, warmer = thinner (new data not included in contouring) Circles with dots = new seismic data Numbered labels = difference between new and old data in kilometers Buffer around new data = radius 100 km where old data removed for interpolation Purple circles = Extensional White squares = Magmatic
DRAFT Purple circles = Extensional White squares = Magmatic Same as slide one, but colors rescaled to match reinterpretation in slide 3
DRAFT Colors = crustal thickness, warmer = thinner (includes new data IDW, nn, po = 5) Circles with dots = new seismic data Numbered labels = difference between new and old data in kilometers Buffer around new data = radius 100 km where old data removed for interpolation Purple circles = Extensional White squares = Magmatic