Download
1 / 8
80 likes | 207 Vues
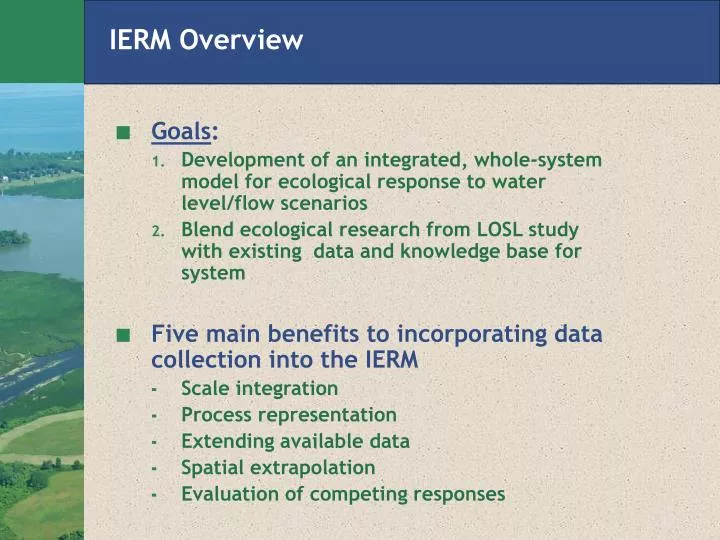
IERM Overview. Goals : Development of an integrated, whole-system model for ecological response to water level/flow scenarios Blend ecological research from LOSL study with existing data and knowledge base for system Five main benefits to incorporating data collection into the IERM

E N D
IERM Overview • Goals: • Development of an integrated, whole-system model for ecological response to water level/flow scenarios • Blend ecological research from LOSL study with existing data and knowledge base for system • Five main benefits to incorporating data collection into the IERM • Scale integration • Process representation • Extending available data • Spatial extrapolation • Evaluation of competing responses
Benefit #1: Scale Integration • IERM will provide means for integrating a range of spatial and temporal scales • Includes H&H inputs as well as ecosystem interactions • Example: Plant Community Response (long-term) Fish Response (seasonal) H&H Inputs (weekly) Algal Response (weekly) Muskrat Response (annual)
Benefit #2: Process Representation • Representation of processes that explain community/population dynamics • Process-based model provides predictive capability • Connects indicator to stressors • Potentially connects indicator species to entire community
Process Representation – Sport Fish Example Water Level & Flow Nutrient Sources Species or Guild Habitat Quantity & Quality Temperature YOY Abundance Growth Predation Natural Mortality Phytoplankton (Graduation) Zooplankton Juvenile Abundance Growth Predation Natural Mortality Stocking Planktivorous Fish (Graduation) Adult Abundance Growth Natural Mortality Reproduction Harvest
Benefit #3: Extending Available Data • Model can account for time lag in cause-effect relationships • Measured fish guild response depends on initial community abundance/structure prior to field experiment • Consider feedbacks between ecosystem components (e.g. muskrat cattails)
Benefit #4: Spatial Extrapolation • IERM provides avenue for extending results for a localized area to other parts of the system • Need to include all important governing factors to make extrapolation work • Examples: • Extend results for 32 Lake Ontario wetlands to other wetland areas • Extend dabbling duck nesting success for Lake St. Pierre to Lake Ontario
Benefit #5: Evaluate Competing Responses • Data collection efforts address responses for individual species • IERM provides “big picture” evaluation of all species responses • Example: • Regulation “Scenario X” impacts: • Wetland diversity • Northern pike population • Dabbling duck population • Muskrat population
Evaluate Competing Responses - Example Regulation Lake Ontario WL Variations St. Lawrence Flow Variations Cattail Abundance Cattail Abundance Wetland Plant Diversity Wetland Plant Diversity Northern Pike Habitat Quality Northern Pike Habitat Quality Muskrat Habitat Quality Muskrat Habitat Quality