Download
1 / 11
110 likes | 419 Vues
QUICKSTART Pareto Chart. Pareto Chart. Objectives. Understand what the Pareto law is Understand what a Pareto diagram is Provide Pareto analysis by level Provide examples of Pareto diagrams Understand how a simple tool can be very powerful in problem solving. Pareto Law.

E N D
Pareto Chart Objectives • Understand what the Pareto law is • Understand what a Pareto diagram is • Provide Pareto analysis by level • Provide examples of Pareto diagrams • Understand how a simple tool can be very powerful in problem solving
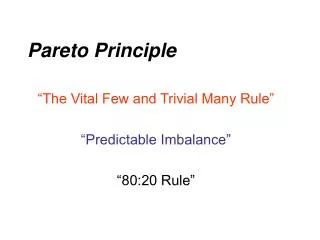
Pareto Law • The Pareto law states that a small number of the causes is responsible for a large percentage of the effects. • It is also called the 80-20 rule
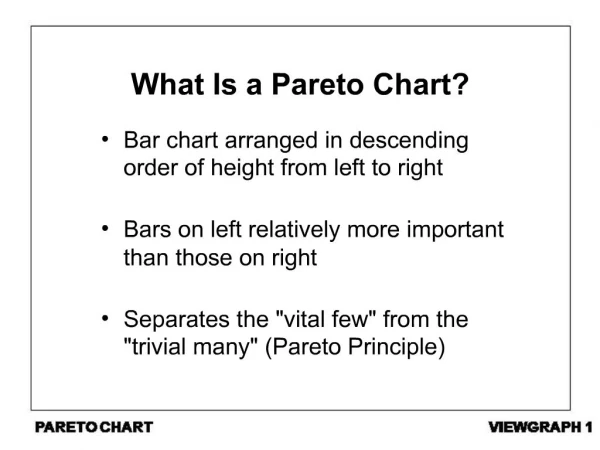
Pareto Diagram A data display tool that breaks down discrete observations into separate categories for the purpose of identifying the “vital few” and separating them from the trivial many Definition Frequency C A B E D Reason
Pareto Chart: examples 15 % of the customers generate 80% of the sales!
Pareto & Process improvement • Gathers input from all team members • To logically group potential causes for defects (x’s) • Helps to test ideas • Helps scope a project Helps to focus improvement efforts on areas where the largest gains can be made
Constructing a Pareto diagram • Define categories • Choose them based on impact • Assure the “other” category is small • Sort data in descending order • Plot the data • (May need several Pareto’s to hone in on potential causes)
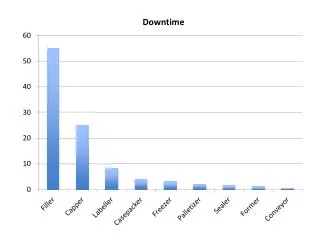
first level example Pareto Chart on inspection rejections Simple and very powerful tool
second level Team tests ideas and/or kill ghosts: Pareto on missing screws by shift Any relationship between the numbers of missing screws and the shift?